Pneumonia Detection and Classification Using Deep Learning CNN model
 |
|---|
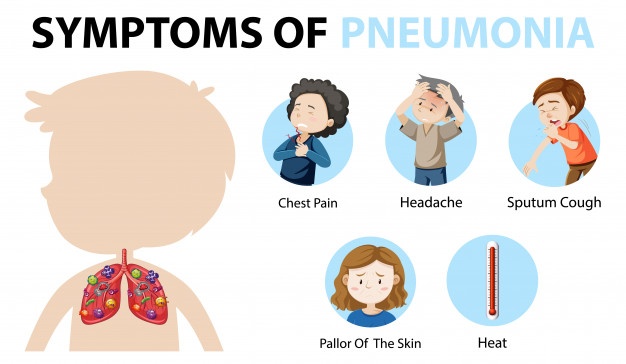
| Photo credit: freepik.com |
For my full code, please visit this link
Abstract
Pneumonia is an infection of one or both of the lungs caused by bacteria, viruses, or fungi. It is a serious infection in which the air sacs fill with pus and other liquid. Clinical pneumonia in children under five years of age is still the leading cause of childhood mortality in the world (Rudan, et al., 2004). Pneumonia causes the death of around 700,000 children every year and affects 7% of the global population. To detect pneumonia, chest X-rays are performed, however, even for a trained radiologist and doctors, it is very challenging to examine chest X-rays and try to diagnose whether pneumonia has developed or not.
A novel approach to diagnose chest X-rays for pneumonia is to apply deep learning techniques to train the model for both pneumonia infected lungs and healthy lungs. Then, we can use the model to detect for pneumonia. However, this novel approach still need a lot of finetuning and work before it can accurately detect pneumonia (Stephen, 2019). By applying deep learning techniques to detect pneumonia, it can open the door to more opportunities and more ways to health care diseases prevention and detection. This project seeks to create a novel approach to diagnose chest X-rays for pneumonia through the use of deep learning, particularly convolutional neural network, by creating a predictive model through the use of training an existing pneumonia images from patients.
Introduction
The World Health Organization estimates that over 4 million premature deaths occur annually from household air pollution-related diseases including pneumonia. Over 150 million people get infected with pneumonia on an annual basis, especially children under 5 years old (Stephen, 2019). Pneumonia is an infection in one or both of the lungs which causes the air sacs in the lungs to fill up with fluid or pus. Pneumonia can be caused by bacteria, viruses or fungi. To be able to detect pneumonia, doctors can order for X-ray scans of the lungs to determine if lungs are filled with fluid or not. However, X-ray images can be hard to interpret as they are black and white in color, thus, it is very challenging to examine, diagnose and conclude a patient has pneumonia or not. Nowadays, a novel approach to detect pneumonia is to use deep learning models, particularly convolutional neural network models, to predict using patients’ X-ray images.
CNN, or convolution neural network, is a deep learning algorithm which can take in an input image, assign importance to various aspects or objects in the image and be able to differentiate one from the other (Saha, 2018). CNN-motivated deep learning algorithms have become the standard choice for medical image classifications although the state-of-the-art CNN-based classification techniques pose similar fixated network architectures of the trial-and-error system which have been their designing principle (Stephen, 2019). Using patients’ lungs X-ray image scans, this paper attempts to create a convolutional neural network predictive model to detect whether a patient has pneumonia or not.
Dataset
The dataset used in this paper is publicly available on Kaggle website and can be accessed through the link below:
1. Kaggle Link
An alternative link to the dataset is directly through the researchers’ website:
2. Researchers’ Website
The dataset was created by Daniel Kermany and his team. This dataset contains validated OCT and chest X-ray images. It is organized into 3 folders (train, test, val) and contains subfolders for each image category: Pneumonia or Normal. There are 5,863 X-Ray images and 2 categories: Pneumonia or Normal. Chest X-ray images (anterior-posterior) were selected from retrospective cohorts of pediatric patients of one to five years old from Guangzhou Women and Children’s Medical Center, Guangzhou. All chest X-ray imaging was performed as part of patients’ routine clinical care. For the analysis of chest x-ray images, all chest radiographs were initially screened for quality control by removing all low quality or unreadable scans. The diagnoses for the images were then graded by two expert physicians before being cleared for training the AI system. In order to account for any grading errors in the images, the evaluation set was also checked by a third expert (Kermany, 2018).
Methods
For this project, it is different than other projects we have done in the past as the dataset does not contain any values but rather it is X-ray scan images that are separated into 2 categories: pneumonia and normal. Thus, we will separate this into 2 phases:
• Phase 1 – exploratory data analysis. This phase is the first step in all data science analysis assignment. The dataset contains images that are in either pneumonia or normal category. Thus, we want to explore its distribution first before we build our model
• Phase 2 – train and create our CNN model. This phase is where we attempt to train and create our model. In addition, we will also take a look at the accuracy of
our model and graph it in a plot. Convolutional Neural Network for this project is produced using Keras and Tensorflow package in Python.
Once our model has created, we will test the model using a few X-ray images and see if it can correctly detect and predict what the condition of the X-ray images are, either pneumonia or healthy.
Results
Phase 1 - Exploratory Data Analysis (EDA)
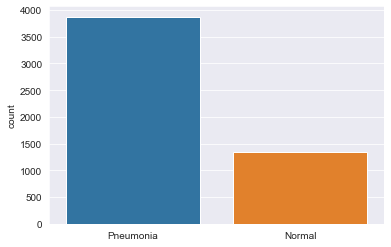
The first step to any data science analysis was to understand our dataset and its distribution. By looking at the dataset, we can see whether or not if it has been biased toward one group or not. In this phase, I chose to look at it using histogram plot to compare distribution between the two groups: pneumonia and normal which is shown in Figure 1.
 |
|---|
| Figure 1: Histogram distribution between pneumonia and healthy lungs. |
In Figure 1, the distribution is imbalanced as there are more X-ray images for pneumonia group compared to the normal group. Thus, we may have to adjust a few parameters to avoid overfitting and help balance out between the classes in our dataset. Figure 2 shows an example of how pneumonia lungs look like under an X-ray image scan.
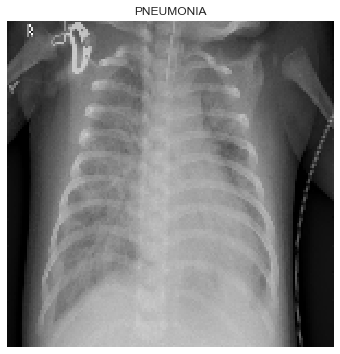 |
|---|
| Figure 2: X-ray image scan of lungs with pneumonia. |
Figure 3 is an example X-ray image scan of healthy lungs where we can see the lungs are much darker in color.
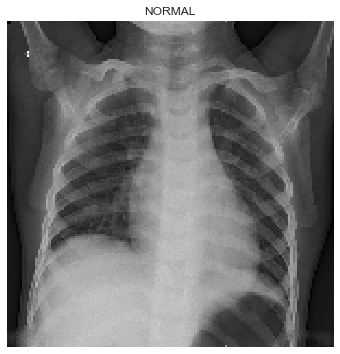 |
|---|
| Figure 3: X-ray image scan of healthy lungs. |
Phase 2 – Model Creation
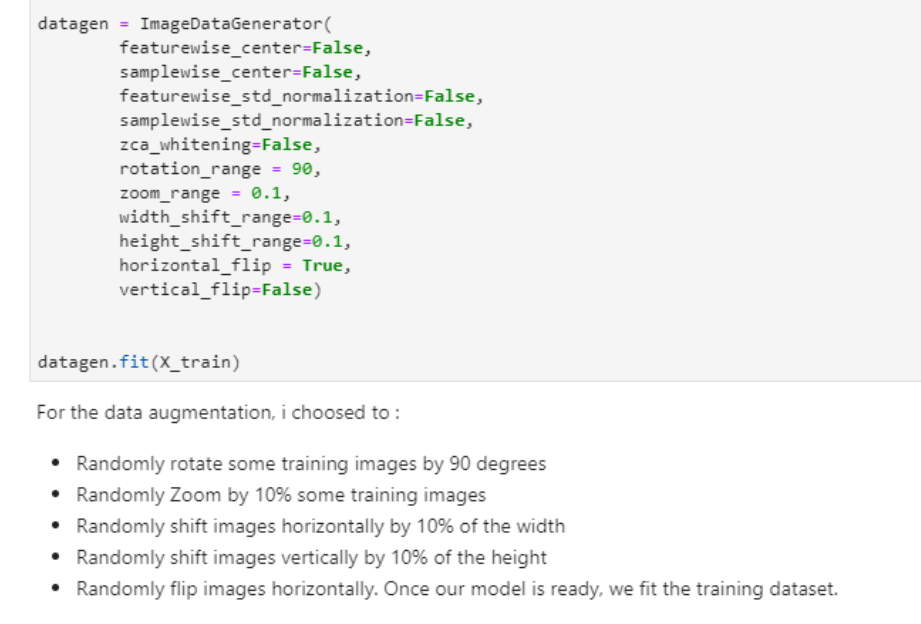
In this phase, we will begin to create our CNN, or convolutional neural network model. Since there was a bias in our dataset, we will also perform data augmentation. Data augmentation steps ensure to improve the quality as well as the size of the dataset in addition to solve overfitting problems and enhances the model’s generalization ability during training (Stephen, 2019). The settings for data augmentation can be found in Table 1 in Appendix A section of this paper. During data augmentation process, the rotation range denotes the range in which the images were randomly rotated during training, for example in this case, we chose 90 degrees. Width shift is the horizontal translation of the images by 10 percent, and height shift is the vertical translation of the images by 10 percent. The zoom range randomly zooms the images to the ratio of 10 percent, and finally, the images were flipped horizontally.
The CNN model which consists of two major parts: the feature extractors and a classifier, or sigmoid activation function. Each layer in the feature extraction layer takes its immediate preceding layer’s output as input, and its output is passed as an input to the succeeding layers. The architecture of the model in this project consists of the convolution, batch normalization, max-pooling, and classification layers combined together. The feature extractors comprise conv3 × 3, 32; conv3 × 3, 64; conv3 × 3, 64; conv3 × 3, 128; conv3 × 3, 256, max-pooling layer of size 2 × 2, and a RELU activator between them. The output of the convolution and max-pooling operations are assembled into 2D planes called feature maps, and we obtained 150 × 150 × 32, 75 × 75 × 64, 38 × 38 × 64, 19 × 19 × 128, and 10 × 10 × 256 sizes of feature maps, respectively, for the convolution operations are 75 × 75 × 32, 38 × 38 × 64, 19 × 19 × 64, 10 × 10 × 128, and 5 × 5 × 256 sizes of feature maps from the pooling operations, respectively, with an input of image of size 150 × 150 × 1 as shown in Table 2. It is worthy to note that each plane of a layer in the network was obtained by combining one or more planes of previous layers.
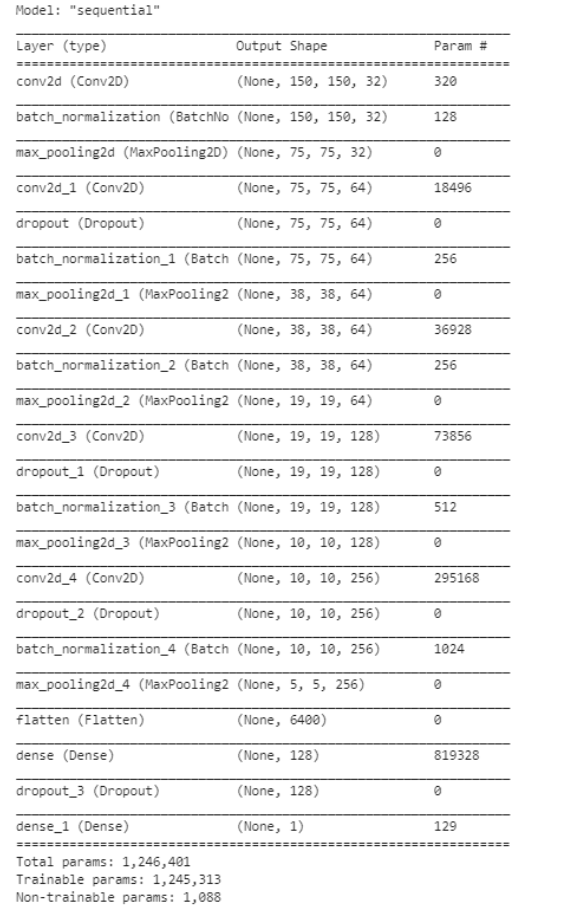 |
|---|
| Table 2: Output of the CNN model network architecture. |
The classifier is placed at the far end of the proposed convolutional neural network (CNN) model. It is simply an artificial neural network (ANN) often referred to as a dense layer. This classifier requires individual features (vectors) to perform computations like any other classifier. Therefore, the output of the feature extractor, or CNN part, is converted into a 1D feature vector for the classifiers. This process is known as flattening where the output of the convolution operation is flattened to generate one lengthy feature vector for the dense layer to utilize in its final classification process. The classification layer contains a flattened layer, a dropout of size 0.2, two dense layers of size 128 and 1, respectively, a RELU between the two dense layers and a sigmoid activation function that performs the classification tasks.
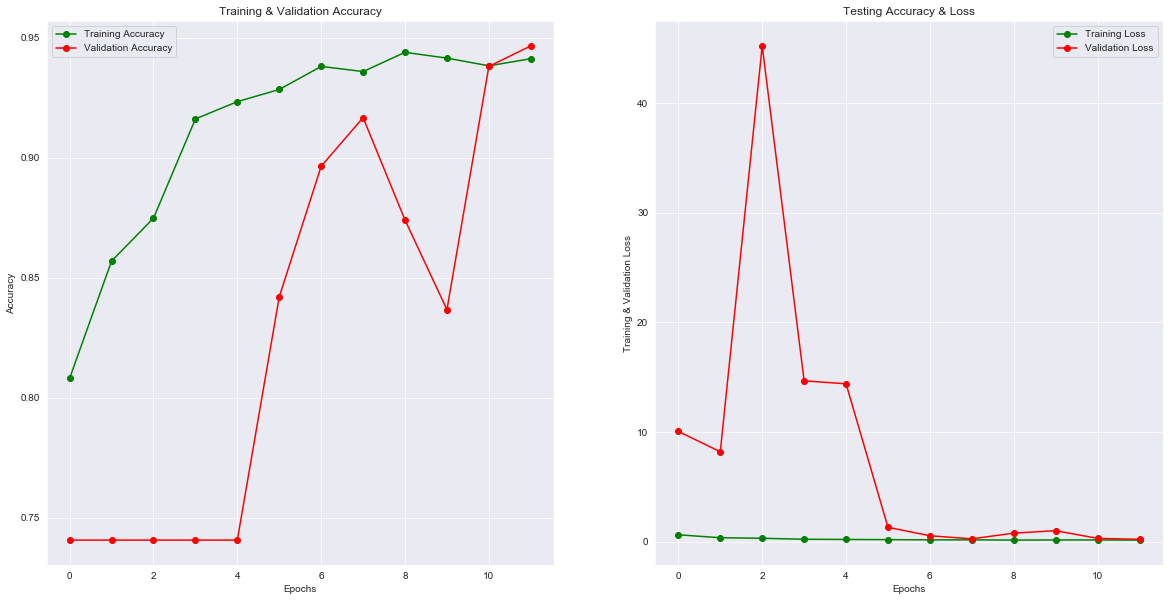 |
|---|
| Figure 4: Performance of the model training. |
Methods such as data augmentation and learning rate variation were deployed to assist in fitting our dataset into deep convolutional neural network architecture. Results from training our model were obtained in Figure 4. The final results obtained are training loss = 0.1513, training accuracy = 0.9413, validation loss: 0.2212, and validation accuracy of 0.9466. The overall loss of the model is 0.2065 and the accuracy of the model is 91.64%.
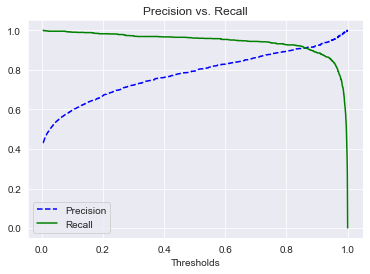
In addition, we wanted to compare between precision and recall; we want to get the optimal range where we want the predicted results to be as precise as possible while not sacrificing too much of the recall in our model.
 |
|---|
| Figure 5: Precision vs. Recall graph. |
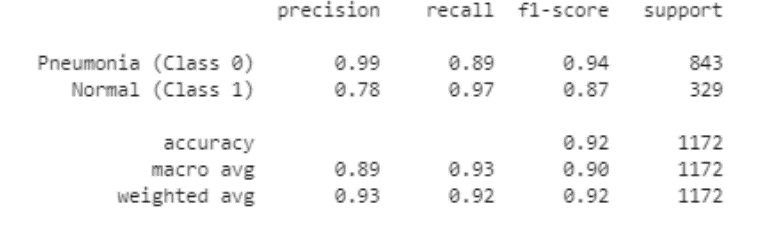
Figure 5 shows us where the threshold in which we can get both optimal precision as well recall in the model. Table 3 gives us an idea of what our precision and recall scores are for both pneumonia and normal predictions as well as a weighted average accuracy score of 92% which correlate with the accuracy score of our model of 91.64%.
 |
|---|
| Table 3: Precision and Recall scores for each class. |
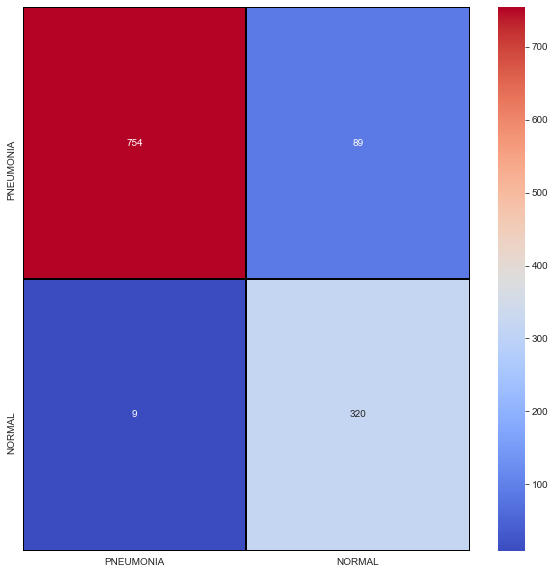
In addition, we also plotted a confusion matrix that will show us of 1172 X-ray images, how many will be true positives, true negatives and those false positives and false negatives. This confusion matrix is shown in Figure 6.
 |
|---|
| Figure 6: Confusion Matrix of our CNN model. |
Discussion and Conclusion
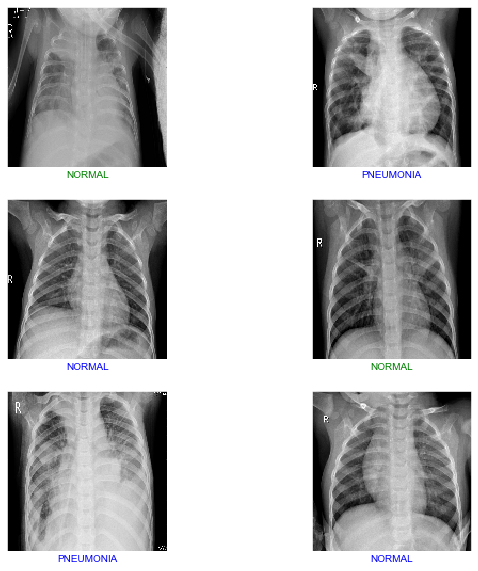
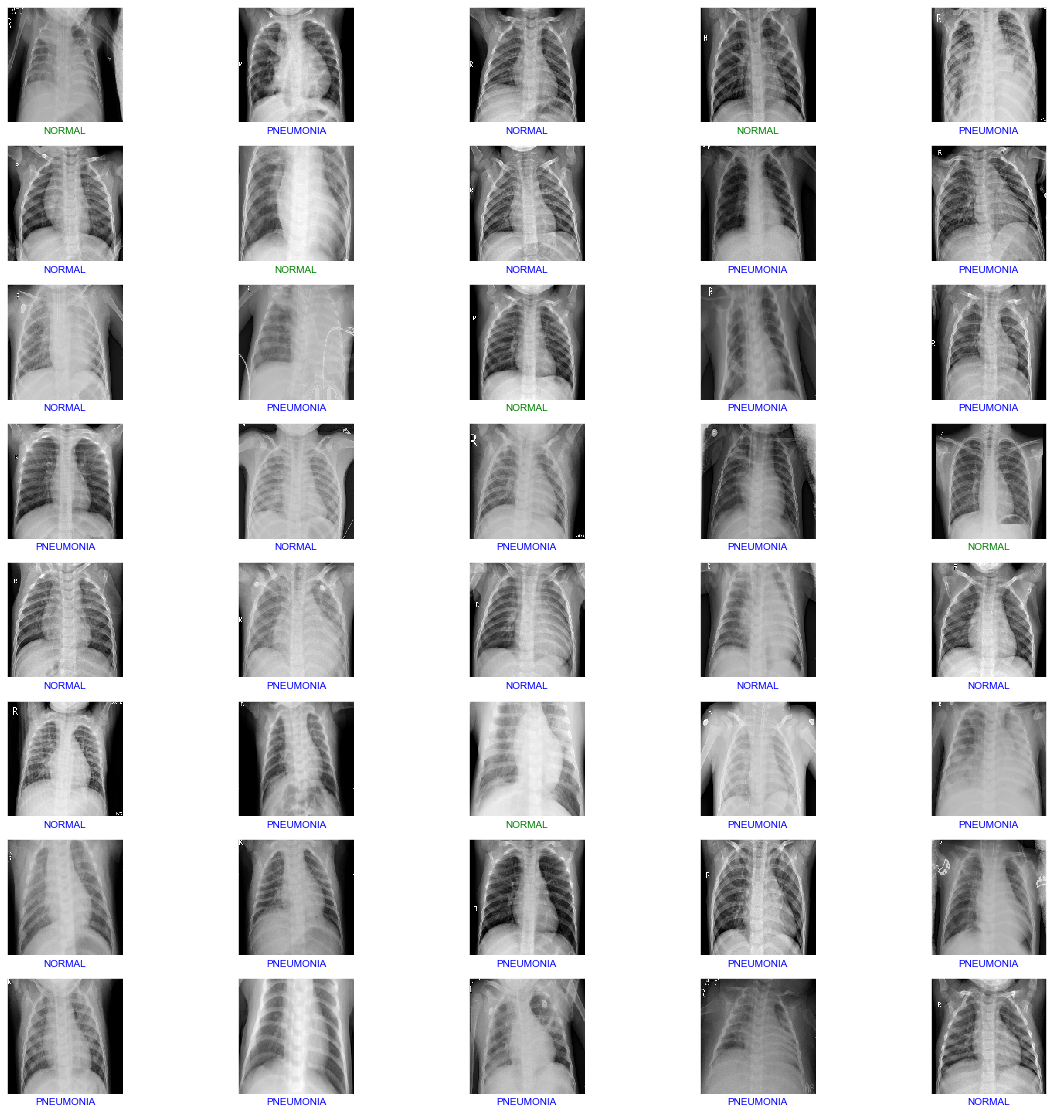
From Figure 6, of 1172 X-ray scan images, 754 will be detected as pneumonia, 320 will be detected as normal lungs. On the other hand, 9 images will be normal lungs but will get detected as pneumonia while 89 are pneumonia lungs, but will be detected as normal. We have developed a CNN model that able to detect and classify lungs classes (either pneumonia or healthy) from patients’ chest X-ray scan images at a high accuracy with a score of 91.64%. The algorithm begins by reshaping the images into smaller sizes than the original size obtained from the dataset. To reassure the integrity of our model, we repeated the training process of the model several times as well as testing it in a small batch of 6 images shown in Figure 7 and a slightly bigger batch of 40 images shown in Figure 8, respectively.
 |
|---|
| Figure 7: Model Prediction and Classification for 6 images. |
 |
|---|
| Figure 8: Model Prediction and Classification for 40 images. |
Looking at both Figure 7 and Figure 8, green labeled images are incorrect classifications while blue labeled images are correct classifications. Out of 6 images, 2 images were incorrectly classified which is around 33% incorrect and 67% correct classifications. On the other hand, testing in a slightly larger scale with 40 images, 6 images were incorrectly classified and 36 were correctly classified which equivalent to 85% accuracy score. With our model, the more images that are being fed, the higher the accuracy and classification score will be.
This project and paper has successfully created a Convolutional Neural Network (CNN) model that can predict and classify X-ray images to either categories: pneumonia or healthy with a 91.64% accuracy. This is a huge breakthrough in classifying and diagnosing pneumonia and improving the health of children and other age groups without having doctors to manually looking through every single X-ray image. On the other hand, the study was limited by the depth of data and with increased access to data from other parts of the world, the training and accuracy of our model will surely increase drastically. There are more improvements to be made in our model. For now, the CNN model that we have created can correctly classify lung X-ray images with a 91.64% accuracy.
Acknowledgements
I want to thank the data science community from Kaggle for the dataset. I would also like to acknowledge Daniel Kermany and his team for creating this dataset. In addition, Python and data science community has been extremely helpful in explaining the concept of Convolutional Neural Network.
Appendix A
 |
|---|
| Table 1: Data augmentation settings for our model. |
References
- Adegbola, R. A. (2012). Childhood Pneumonia as a Global Health Priority and the Strategic Interest of The Bill & Melinda Gates Foundation. Clinical Infectious Diseases, 54(suppl 2), S89–S92. https://doi.org/10.1093/cid/cir1051
- Hashmi, M. F., Katiyar, S., Keskar, A. G., Bokde, N. D., & Geem, Z. W. (2020). Efficient Pneumonia Detection in Chest Xray Images Using Deep Transfer Learning. Diagnostics, 10(6), 417. https://doi.org/10.3390/diagnostics10060417
- I. Rudan, L. Tomaskovic, C. Boschi-Pinto, and H. Campbell, “Global estimate of the incidence of clinical pneumonia among children under five years of age,” Bulletin of the World Health Organization, vol. 82, pp. 85–903, 2004. Bellevue University Page | 17
- Jaiswal, A. K., Tiwari, P., Kumar, S., Gupta, D., Khanna, A., & Rodrigues, J. J. P. C. (2019). Identifying pneumonia in chest X-rays: A deep learning approach. Measurement, 145, 511–518. https://doi.org/10.1016/j.measurement.2019.05.076
- Kermany, D. S., Goldbaum, M., Cai, W., Valentim, C. C. S., Liang, H., Baxter, S. L., McKeown, A., Yang, G., Wu, X., Yan, F., Dong, J., Prasadha, M. K., Pei, J., Ting, M. Y. L., Zhu, J., Li, C., Hewett, S., Dong, J., Ziyar, I., … Zhang, K. (2018). Identifying Medical Diagnoses and Treatable Diseases by Image-Based Deep Learning. Cell, 172(5), 1122-1131.e9. https://doi.org/10.1016/j.cell.2018.02.010
- Pneumonia. (n.d.). John Hopkins Medicine. https://www.hopkinsmedicine.org/health/conditions-and-diseases/pneumonia
- R. Olaf, F. Philipp, and B. Thomas, U-Net: Convolutional Networks for Biomedical Image Segmentation, MICCAI Springer, New York, NY, USA, 2015.
- Sagar, A. (2019, December 17). Deep Learning for Detecting Pneumonia from X-ray Images. Medium. https://towardsdatascience.com/deep-learning-for-detecting-pneumonia-from-x-ray-images-fc9a3d9fdba8
- Saha, S. (2020, October 15). A Comprehensive Guide to Convolutional Neural Networks — the ELI5 way. Medium. https://towardsdatascience.com/a-comprehensive-guide-to-convolutional-neural-networks-the-eli5-way-3bd2b1164a53
- Stephen, O., Sain, M., Maduh, U. J., & Jeong, D.-U. (2019). An Efficient Deep Learning Approach to Pneumonia Classification in Healthcare. Journal of Healthcare Engineering, 2019, 1–7. https://doi.org/10.1155/2019/4180949
- T. I. Mohammad, A. A. Md, T. M. Ahmed, and A. Khalid, “Abnormality detection and localization in chest x-rays using deep convolutional neural networks,” 2017, http://arxiv.org/abs/1705.09850.
- Z. Xue, D. You, S. Candemir et al., “Chest x-ray image view classification,” in Proceedings of the Computer-Based Medical Systems IEEE 28th International Symposium, São Paulo, Brazil, June 2015.