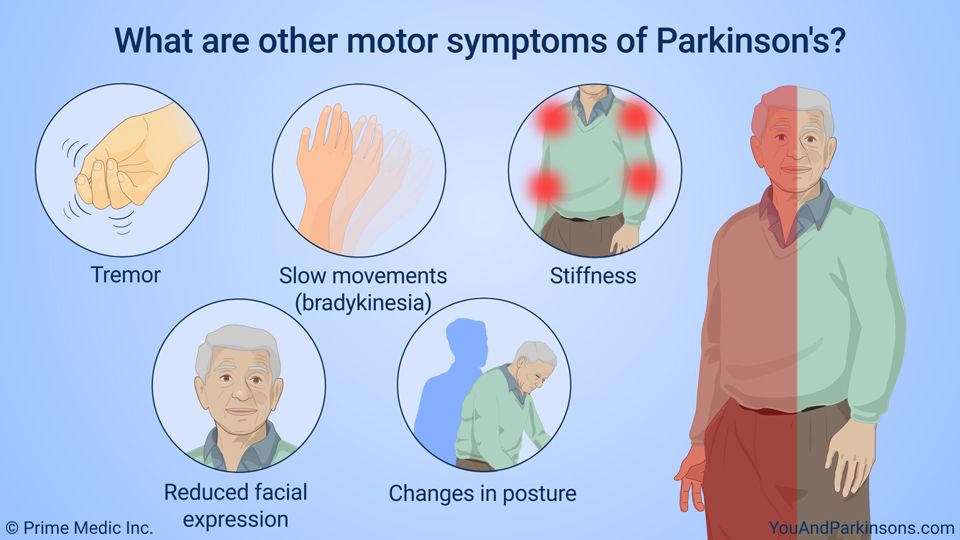
Parkinson’s Disease Early Detection and Prediction
 |
|---|
| Photo credit: Prime Medic Inc. and YouAndParkinsons.com |
For my full code, please visit this link
Abstract
Parkinson’s disease is a progressive nervous system disorder that affects movement. Symptoms often start gradually, sometimes with a slight tremor in the hand. The disorder can also cause stiffness or slowing of movement. Symptoms can also include rigid muscles, impaired posture and balance, loss of automatic movements, speech changes, and writing changes. Typically, there are five stages to Parkinson’s; each stage corresponds both to the severity of movement symptoms and how much the disease affects a person’s daily activity (Spears, n.d.). Doctors also use scales that help them understand the progression of the disease, which focus on motor symptoms (Parkinson’s Foundation, n.d.). Making an accurate diagnosis of Parkinson’s disease can be complicated. The standard diagnosis is clinical, meaning there is not test that can give a conclusive result. Instead, doctors look for certain physical symptoms to be present to qualify a person’s condition as Parkinson’s disease (Johns Hopkins Medicine, n.d.). Early detection, along with the start of treatment, would have a relevant effect on both the quality of life of patients and the healthcare system. This would allow the development of new therapies, and a better understanding of the disease and its evolution (Adams, 2017). This project seeks to analyze and understand if we can create a preditive model for early detection and diagnosis of Parkinson’s Disease based on the tests’ results. The project also further evaluates and analyzes to see which predictive model is best for early diagnosis of Parkinson’s Disease.
Introduction
Parkinson’s Disease, or PD, is a neurodegenerative disorder that affects movements in the nerves. Parkinson’s Disease affects millions of people globally and as of now, there is still no cure for it. Symptoms often start gradually with a slight tremor in the hand or feet before it gets worsen over time. Other symptoms for PD can include rigid muscles, loss of automatic movements, speech and writing diffilculty and impaired posture and balance. There are five stages of Parkinson’s Disease with each stage of PD classifies the severity of the disease and corresponds how much a person’s daily movement activity has been affected. As of now, there is no definitive test for PD by non-specialist clinicians, especially in the early stages where symptoms may be subtle and hard to characterized (Adams, 2017). This results in a high misdiagnosis rate and people can have the disease for many years before diagnosis. Approximately 60,000 Americans are diagnosed with PD every year and it is estimated that 1% of the population over the age of 60 is affected by the disease (Downward & Pool, 2019). Making an accurate diagnosis of PD can be complicated as there are many factors that are considered by doctors. Family history is also considered in addition to the presented symptoms. The standard diagnosis is clinical and that no test can give a conclusive result. Instead, doctors look for certain physical symptoms in the patient that can qualify a person as having PD. A study conducted by three research centers are looking at techniques that analyze speech and vocal patterns that might be effective tools to diagnose PD disease at earlier stages to better prevent and slowdown the progression of the disease (Holtzman, 2013). The study’s results build on past work that demonstrates that speech carries information relevant to an accurate and differential diagnosis of PD and also shows that speech features of interest can be automated and assessed, with diagnostic reliability (Holtzman, 2013). Using a dataset obtained from Kaggle.com, this paper will attempt to answer the question of whether or not we can use speech signal test results to predict whether a person has Parkinson’s Disease or not, and if it is possible to use these tests for early detection of Parkinson’s Disease. In addition, are some speech indicators better at predicting and detecting Parkinson’s Disease than others?
Dataset
The dataset used in this paper is publicly available on Kaggle website and be accessed through the link below:
Parkinson’s Dataset
The dataset was created by Max Little of the University of Oxford, in collaboration with the National Centre for Voice and Speech in Denver, Colorado, who recorded the speech signals. The dataset contains a range of biomedical voice measurements collected from a sample of 31 people, 23 with Parkinson’s Disease and the remaining 8 are healthy individuals. Each column in the table is a particular voice measure, and each row corresponds to one of 195 voice recording from these individuals. The main aim of the data is to discriminate healthy people from those with Parkinson’s Disease, according to the “status” column variable which is set to 0 for healthy and 1 for Parkinson’s Disease. Each row of the CSV file contains an instance corresponding to one voice recording, and there are approximately six recordings per patient (Max A., et. al, 2008).
The variables in the dataset are different measurements of speech. These variables include three measures of vocal fundamental frequency, five measures of variations in fundamental frequency, six measures of variation in amplitude, two measures of ratio of noise to tonal components in the voice, two nonlinear dynamical complexity measures, signal fractal scaling exponent, and three nonlinear measures of fundamental frequency variation (Max A., et. al, 2008).
Methods
In order to build a predictive model, the approach was broken down into three phases. Each phase consist of the tasks that need to be performed before moving onto the next phase. • Phase 1 – exploratory data analysis. This phase is the first step in all data science analysis assignment. Since the dataset contains 22 variables, and most of the variables may or may not correlate with each other. Thus, we need to visualize and understand their distributrions as well as remove any outliers or missing values. • Phase 2 – this is the feature selection phase. Once we understand the relationship and correlation between each variable with our key variable, “status”. We can then select for features that will influence and correlate to our selected main key variable to build the predictive model upon. We will test various machine learning models to see which one is the most suitable for our predictive model. Some of the machine learning models that will be used in this project include support vector machine, k-nearest neighbors, random forest and decision trees and XGBoost Classifier. • Phase 3 – After the features were selected, they will be used to build the predictive models in this phase. The model will be run and trained by using existing data in the dataset. During this phase, each models will then be evaluated to find the model that is best predictive for the diagnosis of Parkinson’s Disease. Once predictive model for Parkinson’s Disease is built, we will also observe to understand which variable or variables are most influenced in our predictive model.
Results
Phase 1 - Exploratory Data Analysis (EDA)
The code and analysis were all done using Python with Jupyter Notebook. The first step to any data science analysis was to understand our dataset by preprocess the dataset and to see if there are any null or missing values. Since there were no missing values, we can begin analyzing and seeing correlations or relationships between different features through the use of histogram plots and other visualizations.
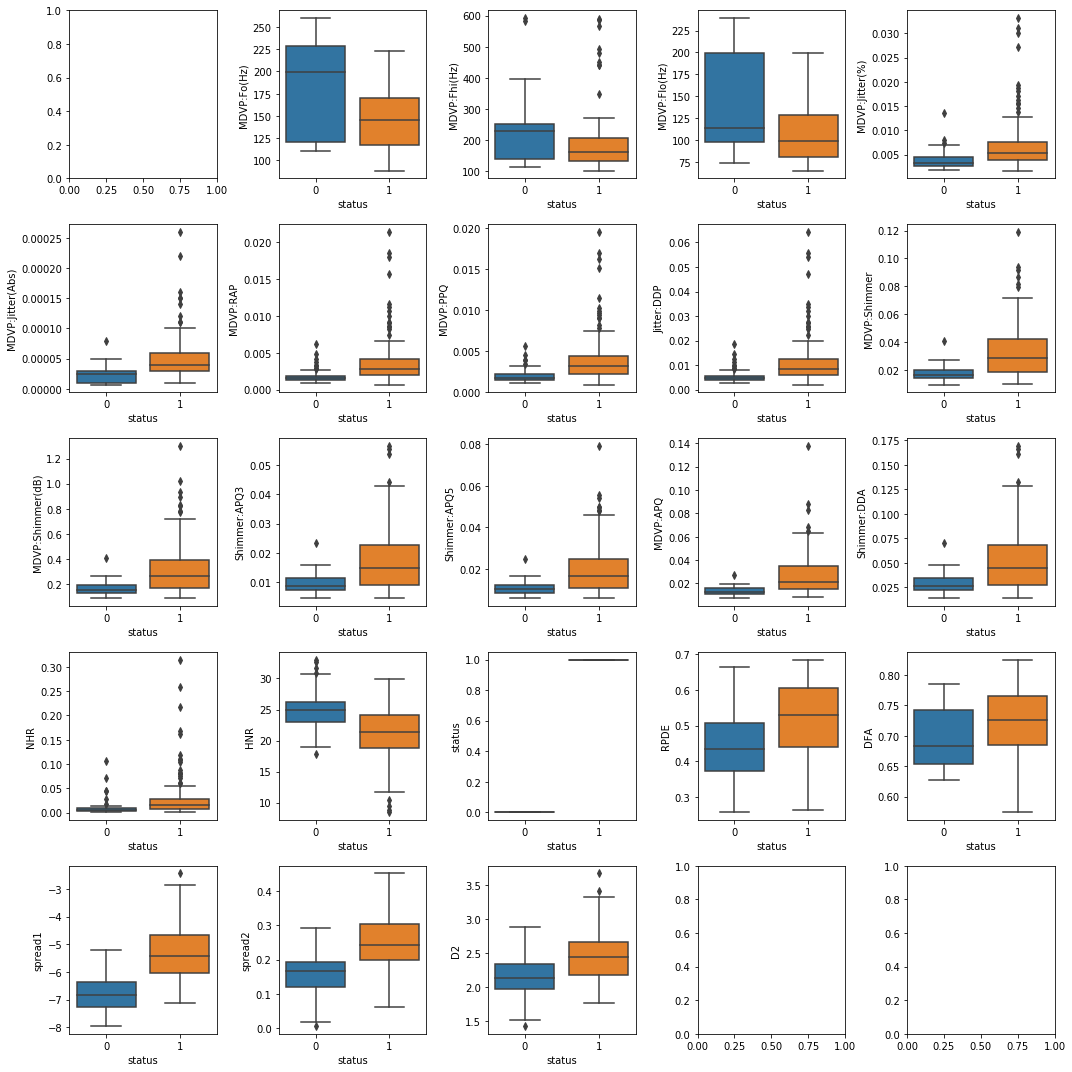 |
|---|
| Figure 1: Box-and-Whisker Plot Distributions of all variables against “status” variable. 0 = Healthy and 1 = Parkinson’s Disease Patient. |
The first analysis was done to understand the distributions of all variables against “status” variable as shown in Figure 1. Since “status” variable is a boolean variable type, 0 indicates healthy and 1 indicates those with PD. These charts were done to observe the distribution of all variables and find which variable has outliers that can affect our modeling steps. From the charts, many columns seem to have outliers with the exception of D2, Spread1, Spread2, and RDPE. Besides plotting box-and-whisker plots of all the variables against “status” variable, we also graphed these variables using histogram plots, shown in Figure 2, to see if their distribution is skewed in any way. A detailed definition of what each variable is in the Appendix A in Table 1.
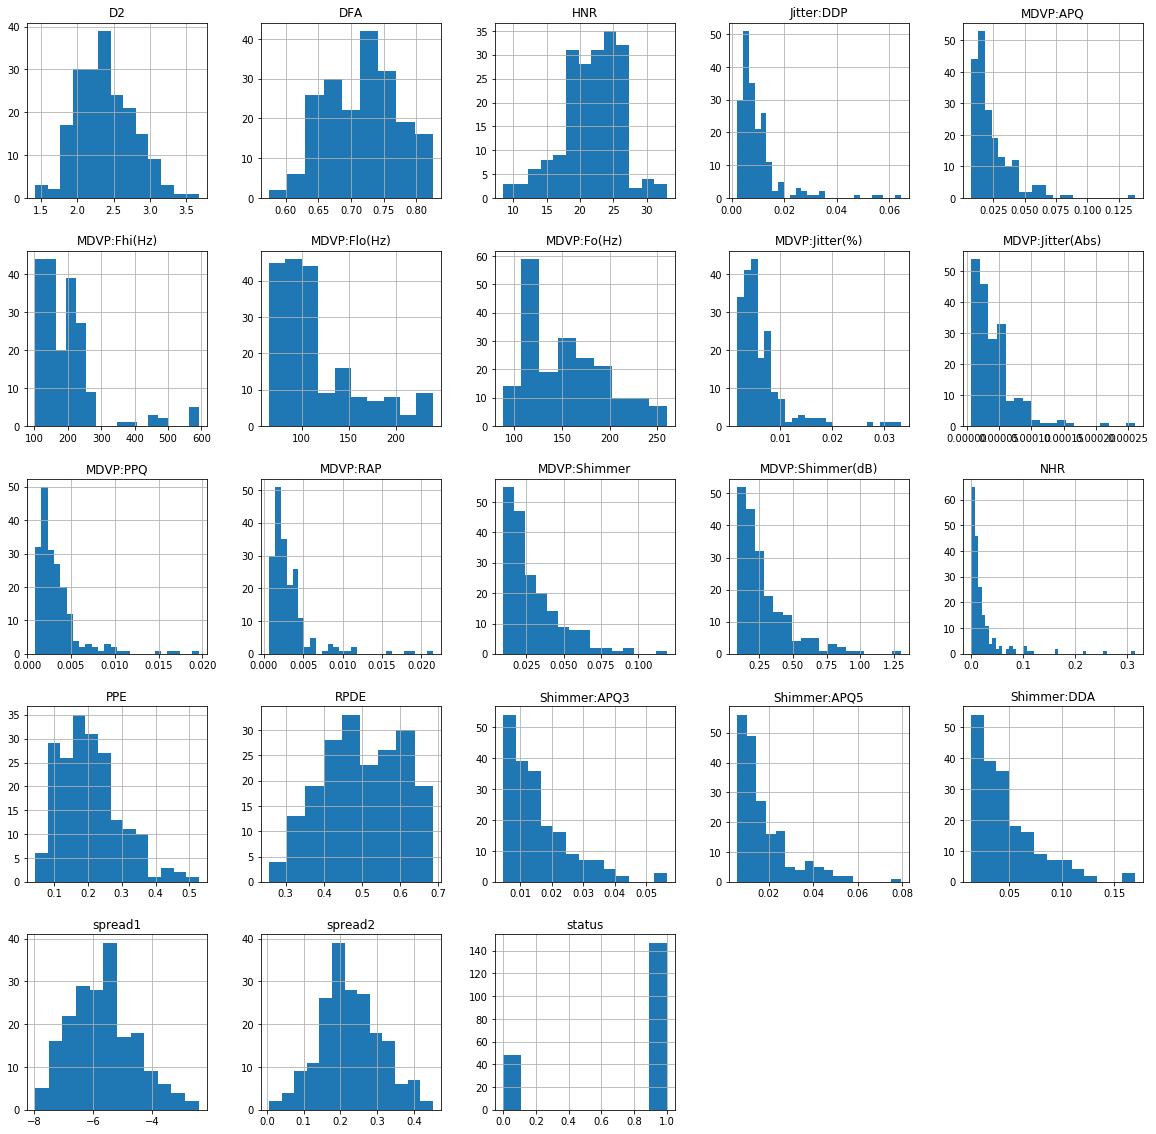 |
|---|
| Figure 2: Histogram distributions of each variable. |
Based on the histogram distributions of each variable, most of the variables are either left or right-skewed except for Spread1, Spread2, D2 and PPE which are fairly normal distributed. Once we understand our dataset, it was time for us to select features to build our model upon. Due to the dataset having a lot of outliers, we will not be removing them individually but we will build the model using a min-max scaler which will be discussed further in Phase 3.
Phase 2 – Features selection
After understanding the overall relationships and trends between different features, we performed a features selection step using a heatmap correlation (Figure 3) to understand the correlations between features and their relationships.
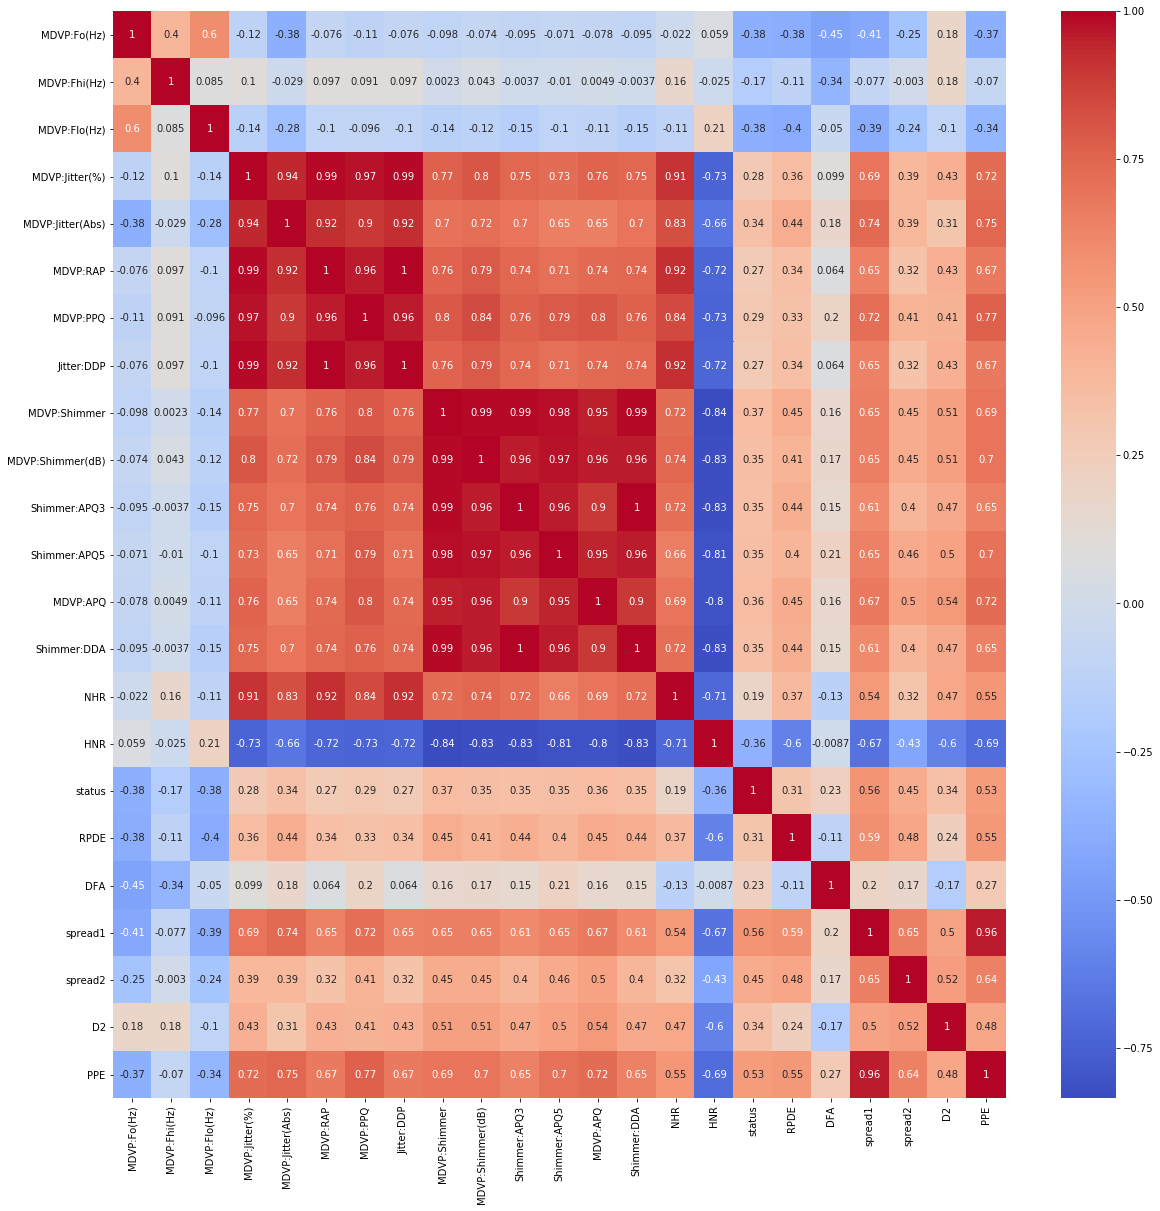 |
|---|
| Figure 3: Heat map correlation of all variables in the dataset. |
In Figure 3, we saw some variables have really strong correlation with other parameters in their own categories such as Shimmer:DDA, Jitter:DDP, and DVP:RAP. Overall, from Figure 3, all the variables seem to have some correlation and influence in the diagnosis of Parkinson’s Disease one way or another. Hence, the reason why doctors performed these voice tests. We decided to include all variables in our predictive model.
Phase 3 – Models Selection and Evaluation
For this phase, we performed multiple machine learning models to determine the model that best fit our dataset. For this project, a few different model techniques were employed for a total of 11 techniques. Classic machine learning models like Logistic Regression, Gaussian Naïve Bayes, K-nearest Neighbors, Decision Trees, Random Forests, and Support Vectors Machines were used in this project, in addition to newer techniques that we also tried like Ada boost Classifier, Ridge Classifier, Extra Trees Classifier, Gradient Boosting Classifier and XGBoost Classifier. For this predictive modeling phase, we created a training and testing set using 70:30 split. Since all variables are related with one another in some ways, we decided to keep all variables. However, since most variables had outliers, we had to perform minimum and maximum scaler. Min-max scaler is a normalization method and by doing so, all features will be transformed into the range of [0, 1], thus, reducing potential biases among variables when fitting our models.
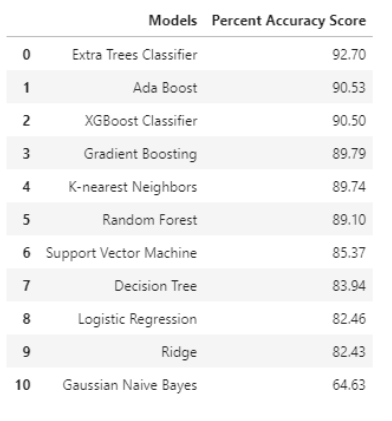
In addition to min-max scaler, we also performed K-fold cross validation, due to the limited data sample in our dataset (n = 31). In K-fold cross validation, when a specific value for k is chosen, it may be used in place of k in the reference to the model, such as k=10 becoming 10-fold cross-validation. In this project, we used k = 5 which equivalents to 5-fold cross-validation. As k gets larger, the difference in size between the training set and the resampling subsets gets smaller. As this difference decreases, the bias of the technique becomes smaller (Brownlee, 2018). After K-fold cross validation was performed, different machine learning techniques were employed, and accuracy score was obtained (Table 2) in Appendix A and graphed as bar plot to compare visually between all the different predictive model techniques (Figure 4).
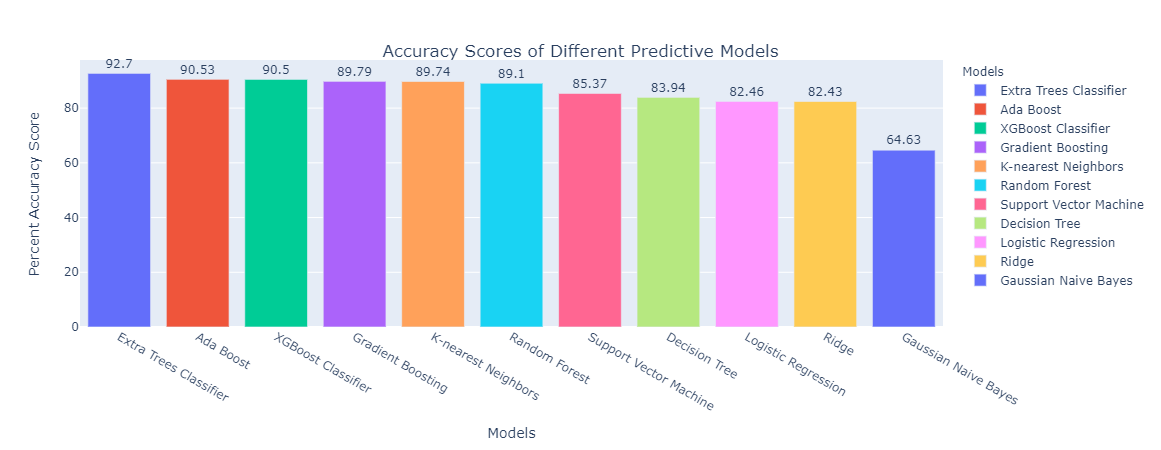 |
|---|
| Figure 4: Accuracy scores ranking of different predictive models. |
From Figure 4, Extra Trees Classifier gave us the highest percent accuracy score of 92.70% and Gaussian Naïve Bayes was the least accurate with 64.63% accuracy. Extra Trees Classifier is a type of ensemble learning technique that is similar to random forest, but it is faster in terms of computational cost and execution time. Extra Trees Classifier randomly chooses the split point and does not calculate the optimal time like how random forest does.
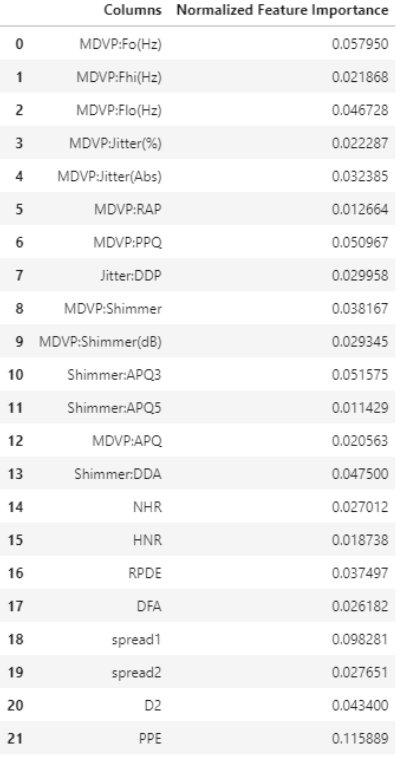
In addition, we wanted to find out the feature or features that have the most influence on Parkinson’s Disease diagnosis and our predictive model. Using Extra Tree feature importance function, we were able to create a graph that plot based on their normalized feature importance value. Table 3 in the Appendix A lists out the normalized feature importance value for each of the variable.
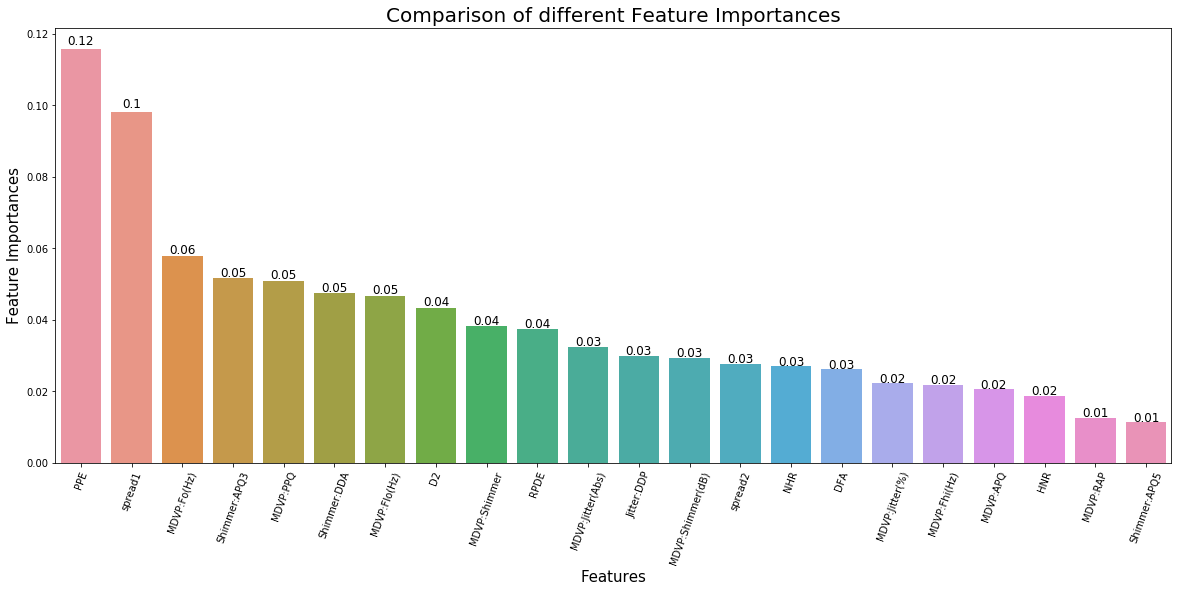 |
|---|
| Figure 5: Comparison of different feature importance. |
Figure 5 shows the plot that indicate the features that are most influence in our model and most important in Parkinson’s Disease diagnosis. Based on Figure 5, features such as PPE, Spread1 and MDVP:Fo(Hz) are most important when it comes to the diagnosis and detection of Parkinson’s Disease.
Discussion and Conclusion
This project was performed in three phases: exploratory data analysis, feature selection, models selection and evaluation. In addition to these three phases, another step was performed to understand the most important features to the diagnosis of Parkinson’s Disease. Phase 1 relied on data analysis techniques such as box-and-whisker plots to understand the variance of each variable and looking for outliers. Histogram plots to observe and determine the skewness of the variables’ distribution in our dataset. Throughout Phase 2 of the project, relevant features were recognized using heat map correlation. Since all features were connected and correlated to the diagnosis status disease, all were included in Phase 3 when we build out our models. In Phase 3, different techniques were used to build models in addition to min-max scaler and k-fold cross validation to normalize a lot of our data to reduce any model biases.
Out of all the models tested, Extra Trees Classifier gave us the highest accuracy score of 92.7% in terms of using these tests (variables) for early detection and diagnosis of Parkinson’s Disease. Furthermore, a method was carried out to understand which features are most important for Parkinson’s Disease diagnosis. As it turns out, the two features that are most important in testing for Parkinson’s Disease are PPE, or Pitch Period Entropy, and Spread1, or Two nonlinear measures of fundamental. PPE is a new measure of dysphonia, or voice disorder, that the study used to measure sensitive changes in speech. Therefore, measuring PPE and Spread1 tests could be a basis for PD diagnosis. The next step to this project is to deploy the built Extra Trees Classifier model to detect the disease in a larger sample set and see if it still giving us the same results before deployment. The earlier the diagnosis, the higher the chance of slowdown the progression of the disease. Early detection of PD could be the start against PD and I believe we will eventually be able to find the cure for it.
Acknowledgements
I want to thank the data science community from Kaggle for the dataset. I would also like to acknowledge Max A. Little and his team for creating this dataset at the University of Oxford, along with the National Centre for Voice and Speech in Denver Colorado, who recorded the speech signals.
Appendix A
 |
|---|
| Table 1: Definition of all variables in the dataset |
 |
|---|
| Table 2: Percent Accuracy Scores for all predictive model techniques |
 |
|---|
| Table 3: Normalized feature importance to the models ranking table |
References
- Adams, W. R. (2017). High-accuracy detection of early Parkinson’s Disease using multiple characteristics of finger movement while typing. PLOS ONE, 12(11), e0188226. https://doi.org/10.1371/journal.pone.0188226
- Brownlee, J. (2020, August 2). A Gentle Introduction to k-fold Cross-Validation. Machine Learning Mastery. https://machinelearningmastery.com/k-fold-cross-validation/
- Downward, E., & Johns Pool, J. (2019, September). How Common Is Parkinson’s Disease? Retrieved from Parkinsons Disease.net: https://parkinsonsdisease.net/basics/statistics/.
- Holtzman, J. (2013, March 24). The Parkinson’s Voice Initiative: Early Diagnosis for Parkinson’s Disease through Speech Recognition. Retrieved from Stanford.edu:https://web.stanford.edu/group/sjph/cgi-bin/sjphsite/the-parkinsons-voice-initiative-earlydiagnosis-for-parkinsons-disease-through-speech-recognition/
- Jankovic J. Parkinson’s disease: clinical features and diagnosis. J Neurol Neurosurg Psychiatry. 2008;79(4):368–76. pmid:18344392
- Johns Hopkins Medicine. (n.d.). How Parkinson’s Disease Is Diagnosed. Retrieved from Johns Hopkins Medicine: https://www.hopkinsmedicine.org/health/treatment-tests-and-therapies/how-parkinson-disease-is-diagnosed.
- Max A. Little, Patrick E. McSharry, Eric J. Hunter, Lorraine O. Ramig (2008), ‘Suitability of dysphonia measurements for telemonitoring of Parkinson’s disease’, IEEE Transactions on Biomedical Engineering
- Medical News Today. (n.d.). Parkinson’s Stages: Signs and symptoms. Retrieved from Medical News Today: https://www.medicalnewstoday.com/articles/320476.
- Pagán FL. Improving Outcomes Through Early Diagnosis of Parkinson’s Disease. Am J Manag Care. 2012;18(September):176–82.
- Parkinson’s Foundation. (n.d.). Parkinson’s Foundation. Retrieved from Parkinson.org: https://www.parkinson.org/Understanding-Parkinsons/Statistics.
- Silva, C. (2018, February 5). Speech Analysis May Help Diagnose Parkinson’s and at Earlier Stage, Study Says. Retrieved from Parkinson’s News Today: https://parkinsonsnewstoday.com/2018/02/05/speech-analysis-can-help-detect-parkinsons-in-early-stages-study-says/.
- Singh, S., & Xu, W. (2020). Robust Detection of Parkinson’s Disease Using Harvested Smartphone Voice Data: A Telemedicine Approach. Telemedicine and E-Health, 26(3), 327–334. https://doi.org/10.1089/tmj.2018.0271
- Spears, C. (n.d.). 10 Early Signs of Parkinson’s Disease. Retrieved from Parkinson’s Foundation: https://www.parkinson.org/understanding-parkinsons/10-early-warning-signs.