Heart Failure Predictions Based on Patients’ Health Attributes
 |
|---|
| Photo credit: UC Health |
For my full code, please visit this link
Abstract
Cardiovascular diseases are the number one cause of death globally, taking an estimated of 17.9 million lives each year, which accounts for 31% of all deaths worldwide. Heart failure occurs when the heart cannot pump enough blood to meet the needs of the body. Machine learning applied to medical records, in particular, can be an effective tool both to predict the survival of each patient having heart failure symptoms (Latha, 2019), and to detect the most important clinical features (or risk factors) that may lead to heart failure (Lawler, 2019). Scientists can take advantage of machine learning not only for clinical prediction, but also for feature ranking. The incorporation of machine learning and data science has the potential to impact on clinical practice in the health care field, becoming a new supporting tool for physicians when predicting if a heart failure patient will survive or not. Indeed, medical doctors aiming at understanding if a patient will survive after heart failure may focus mainly on serum creatinine and ejection fraction (Chicco, 2020). This project seeks to analyze and understand to see if we can create a predictive modeling to know when a patient will have a heart failure disease based on their given health attributes. It furthers test different machine learning models to find the most suitable predictive model.
Introduction
Cardiovascular disease is a general term used for any disease associated with the heart and its blood vessels. A few common cardiovascular diseases include heart failure, heart attack, stroke, and sudden cardiac arrest. Heart failure occurs when the heart cannot pump enough blood to meet the body’s demand. Given the importance of a vital organ such as the heart, predicting heart failure has become a priority for health care professionals (Chicco, 2020). The health care industry contains lots of medical data that are thought to be useful for machine learning to attempt to utilize those data to predict and analyze the risks of a patient experiencing heart failure. Machine learning is a branch of artificial intelligence that can use repetition and adjustment to exploit large quantities of data and identify complex patterns that may go unnoticed by humans (Stephens, 2019). Electronic health records (EHR), or also known as medical records can be considered a useful resource of information to unveil hidden and non-obvious correlations and relationships between patients’ data, not only for research but also for clinical practice (Yang, 2020). Using a dataset that contain patients’ health attributes based on their medical records from Kaggle.com, this paper will attempt to answer the question of whether or not we can predict heart failure risk in a patient based on their health attributes.
Dataset
The dataset used in this paper is publicly available on Kaggle website and can be access through the link provided:
Heart Failure Dataset.
The dataset contains 13 features that provide insights on patients’ clinical, body and lifestyle information. This dataset is a medical record of 299 heart failure patients collected at the Faisalabad Institute of Cardiology and at the Allied Hospital in Faisalabad in Punjab, Pakistan during the month of April-December 2015 (Ahmad, 2017). The sample consisted of 194 men and 105 women with the ages range between 40 and 95 years old. Some features in the dataset are categorical variables such as anaemia, high blood pressure, diabetes, sex, smoking and death event. These categorical features are represented in Boolean typed data. Patients are considered anaemia when their hematocrit levels were below 36% (Chicco, 2020). The remaining features are age, creatinine phosphokinase (CPK), ejection fraction, platelets, serum creatinine, serum sodium, and time. These features are represented as continuous variables. When a muscle tissue gets damaged, creatinine phosphokinase (CPK) flows into the blood. Therefore, heart failure may be an indication with high levels of CPK in the blood (Chicco, 2020). The serum creatinine is a byproduct of creatinine from muscle catalyzation; renal dysfunction may be the reason of high levels serum creatinine (Stephens, 2019). The death_event variable in our dataset indicates if the patient died or survived before the end of the follow-up period; with the follow-up period average out to be 130 days. (Ahmad, 2017).
Methods
In order to build a predictive model, the approach was broken down into three phases. Each phase consist of the tasks that need to be performed before moving onto the next phase.
• Phase 1 – Exploratory Data Analysis
This phase is the first step in all data science analysis assignment. Since the dataset contains 13 variables, and most of the variables may or may not correlate with each other and especially with the feature that we were interested in, which is the death_event variable. Thus, we need to visualize and understand their distributrions. In addition, we need to make sure to check for missing values and outliers.
• Phase 2 – Feature Selection Phase
Once we understand the relationship and correlation between each variable with our primary variable, death_event. We can then select for features that are most influence and have correlation to our selected main variable to build the predictive model upon. We will test various machine learning models to see which one is the most suitable for our predictive model. Various machine learning models that will be used in this model include logistic regression, support vector machine, k-nearest neighbors, random forest and decision trees.
• Phase 3 – Model Selection and Evaluation
After the features were selected, they will be used to build the predictive models in this phase. The model will be run and trained by using existing data in the dataset.
Results
Phase 1 - Exploratory Data Analysis (EDA)
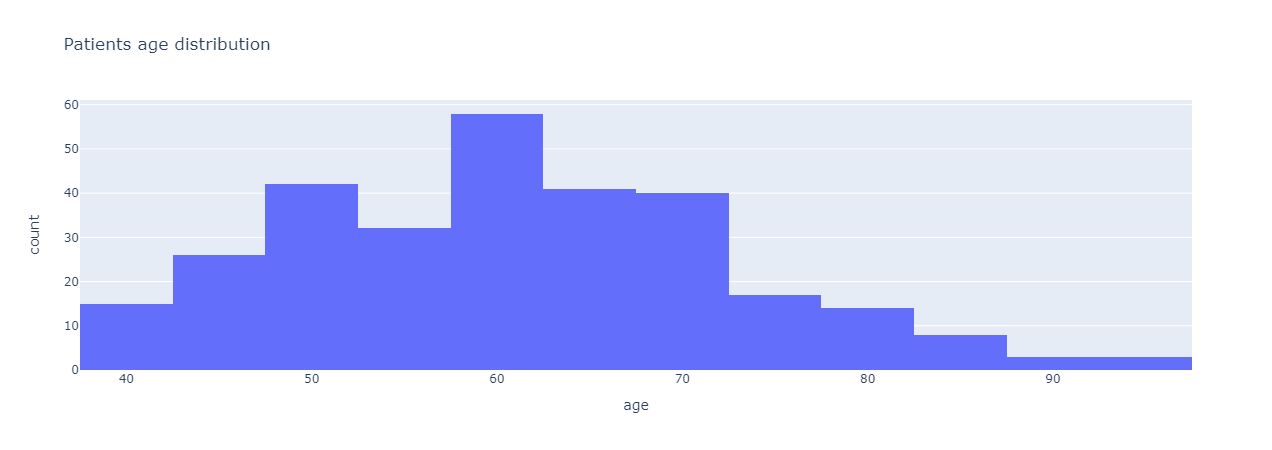
The code and analysis were all done using Python with Jupyter Notebook. The first step to any data science analysis was to preprocess the dataset and to see if there are any null or missing values. Since there were no missing values, we can begin analyzing and seeing correlations or relationships between different features. The first analysis was done to see the distribution in age of all the samples in the dataset.
 |
|---|
| Figure 1: Patients’ age distribution. |
From Figure 1, most of the patients are in the age range of 50 – 70 years old with the majority of patients are around 60 years old and a few are at least 90 years old. From age distribution, we added another variable to see the correlation in age between gender in our sample set. Figure 2 shows a box-and-whisker plot of the correlation between age and gender in the sample.
 |
|---|
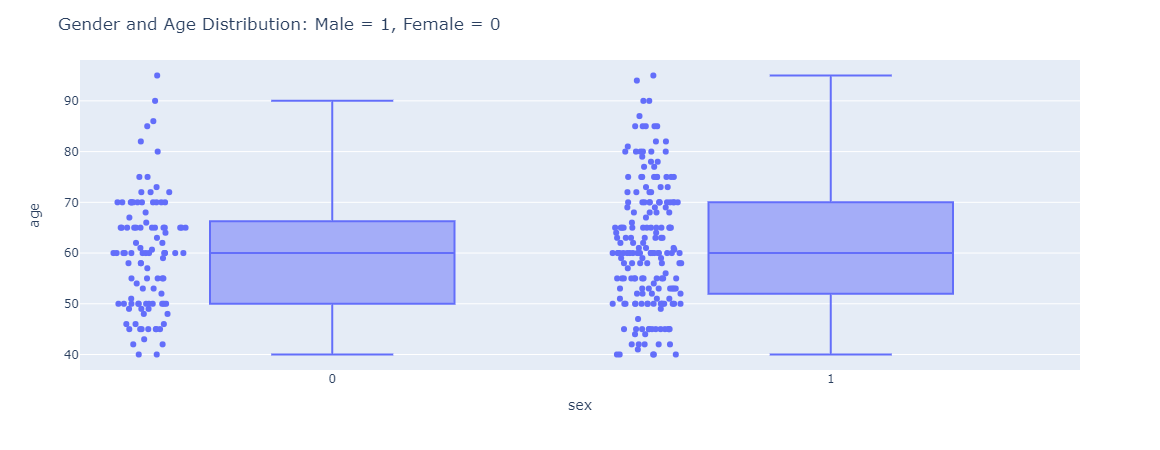
| Figure 2: Gender and Age distribution with male being 1 and female being 0. |
Based on the gender and age distribution in Figure 2, the variation in the age for male patients are much higher than female patients. The spread in age for male is uniformly from the age 40 - 90 whereas female age distribution is mostly concentrated around 40 – 70.
 |
|---|
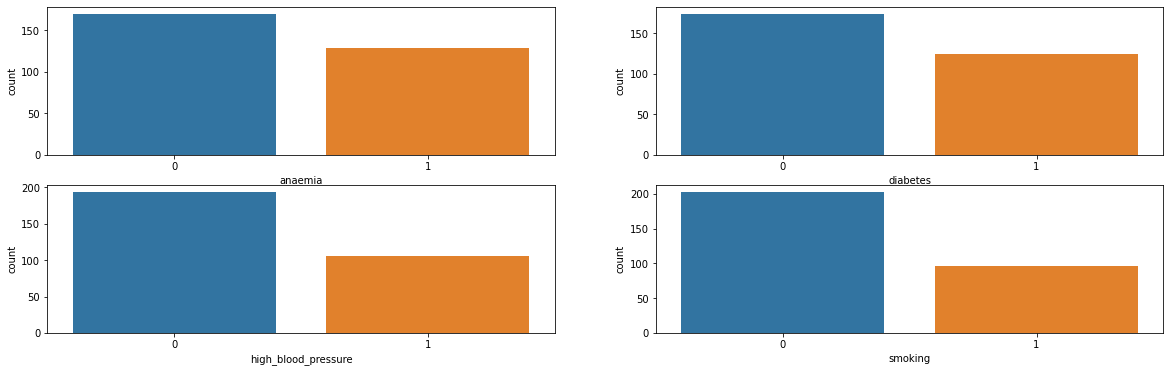
| Figure 3: Distributions of all categorical variables in the dataset. |
From Figure 3, around 43% of the sample has anaemia, 41% has diabetes, 35% has high blood pressure, 32% do smoke, and some may have more than one conditions. Digging deeper into the dataset and seeing relationships between different features, we plotted a histogram to compare death_event versus number of follow-up visits as shown in Figure 4.
 |
|---|
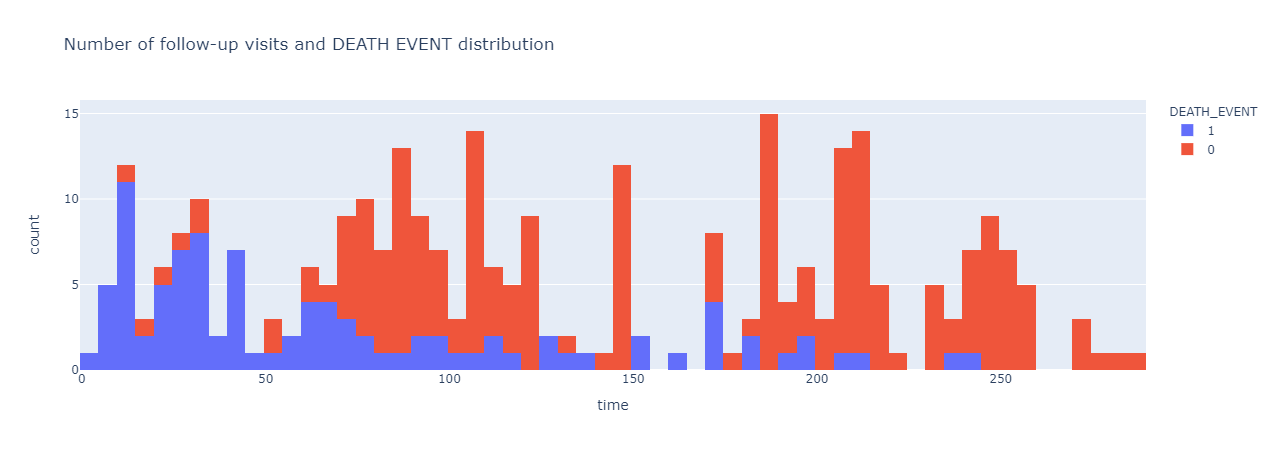
| Figure 4: Number of follow-up visits and death_event occurrence distribution. |
It seems like the frequency in number of follow-up visits correlate with death_event, or the chance of a patient being survived or dead with a heart failure disease. The more frequently a patient visit for their regular follow-up visits, the higher the chance they will survive and vice versa. Previously, it is thought that creatinine phosphokinase will flow into the blood if a muscle tissue gets damage, which may also be one of the indications of heart failure (Stewart, 2020). Thus, we wanted the find any correlation between creatinine phosphokinase and death event, which is shown in Figure 5.
 |
|---|
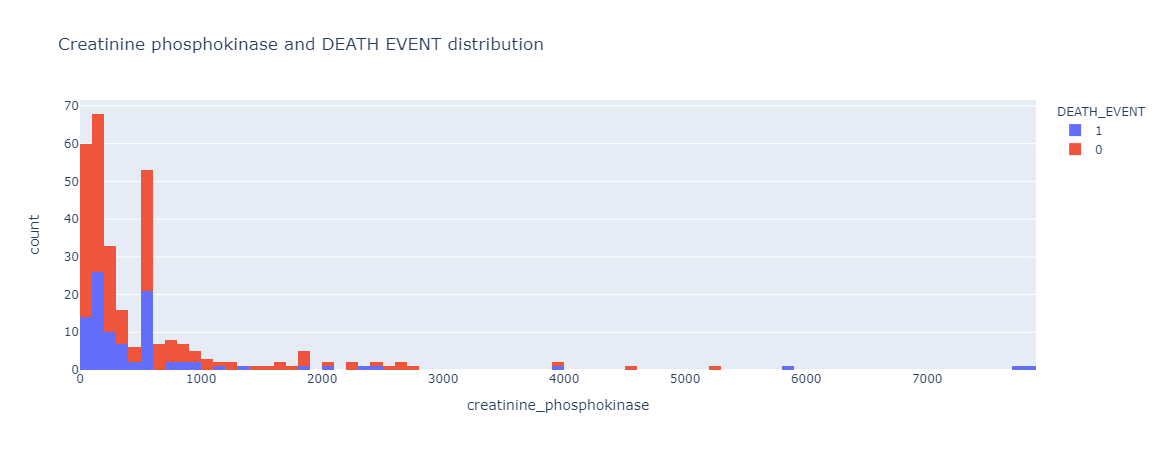
| Figure 5: Relationship and distribution between creatinine phosphokinase level and death event. |
The distribution trend for Creatinine Phosphokinase, or CPK, seem to be very similar between those samples that have survived and those who did not survive the heart failure event. There were a few outliers in the CPK level, but those were very minimal and has been disregarded in the analysis.
 |
|---|
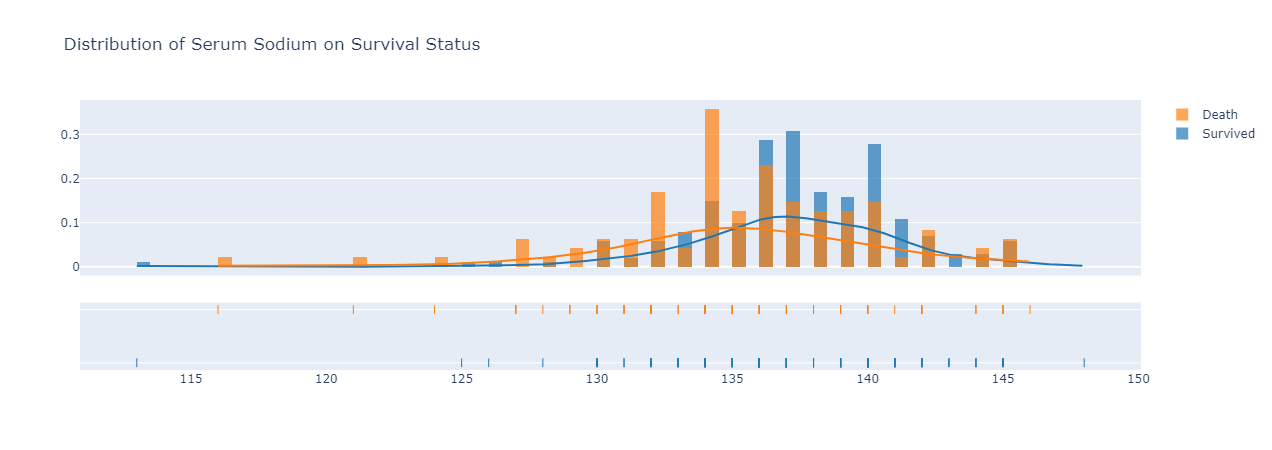
| Figure 6: distribution of serum sodium on survival status. |
Looking at the distribution trend for serum sodium on survival status either survived or death due to heart failure in Figure 6, those survived heart failure have a slightly higher distribution curve of serum sodium in their bloodstream than those who did not survive after their heartfailure disease. The median serum sodium in bloodstream for those survived was around 137, while those did not survive had a median level of 134.
 |
|---|
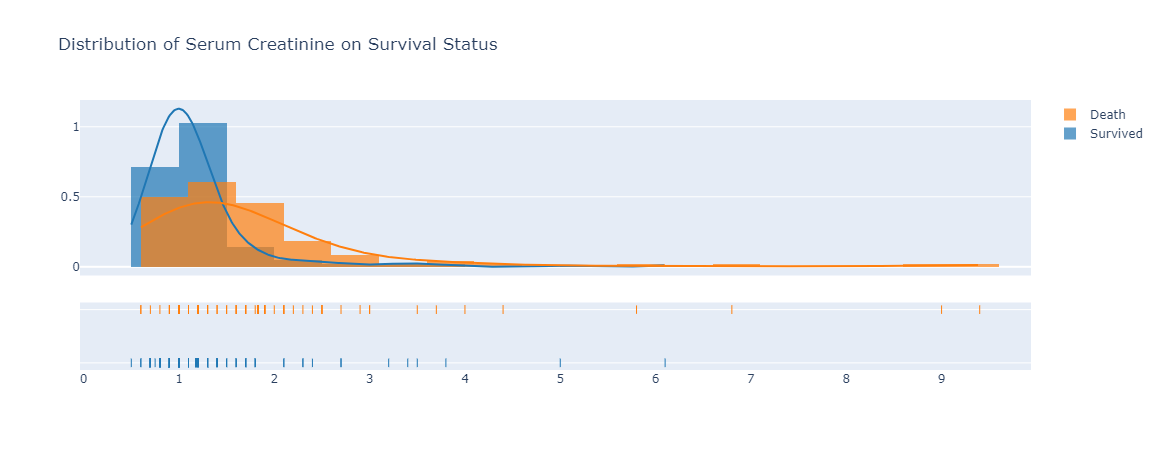
| Figure 7: distribution of serum creatinine on survival status. |
Serum creatinine level is lower in those survived with heart failure disease compared to those did not survive, based on the trend observed in Figure 7. The median serum creatinine level of 1 is for those who survived with heart failure. On the other hand, the median serum creatinine level for those who died from heart failure was 1.5. The serum creatinine is a byproduct of creatinine and renal dysfunction may be the reason of high levels serum creatinine (Stephens, 2019) which can explain why those who passed away due to heart failure had such high level of serum creatinine.
 |
|---|
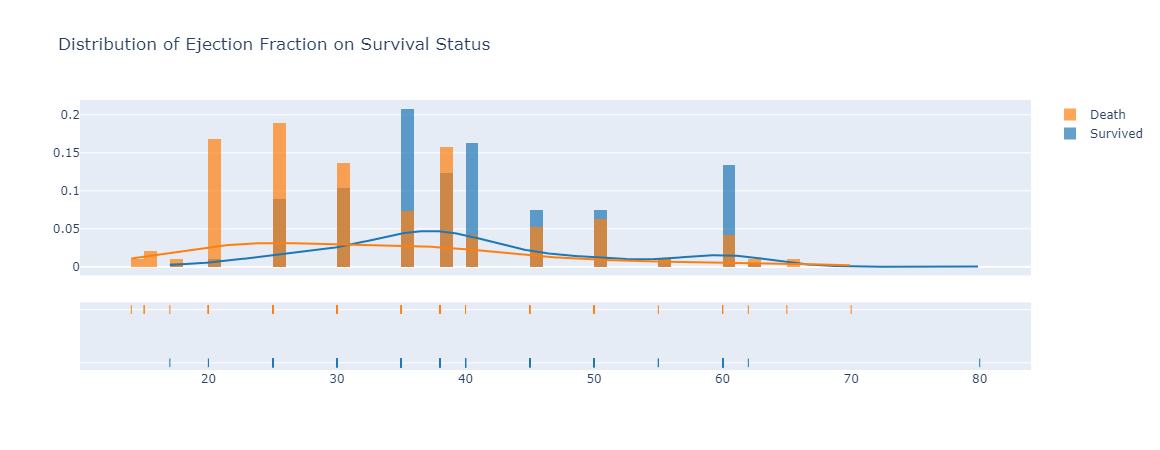
| Figure 8: The distribution of ejection fraction between death and survived group of patients with heart failure. |
With regards to ejection fraction, we saw a high percentage of ejection fraction in blood as one of the characteristics in the group of patients that survived and live after been diagnosed with heart failure. However, for those died due to heart failure, they had a much lower percentage of ejection fraction in their blood (Tripoliti, 2017). Another variable and trend we wanted to look at was the platelet counts to see if it has any influence on death events. However, we did not see any differences between the number of platelets in patients that survived versus patients that died due to heart failure. The chart, or Figure 9 can be observed in Appendix A section.
Phase 2 – Features selection
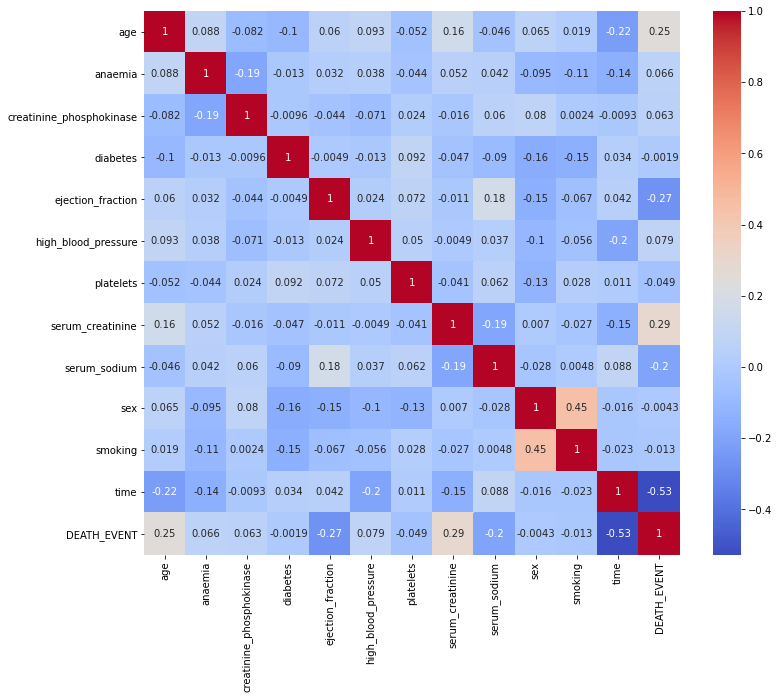
After understanding the overall relationships and trends between different features, we performed a feature selection step using a heatmap correlation to see which features have the most influence on death event variable shown in Figure 10.
 |
|---|
| Figure 10: Heat map correlation of all variables in the dataset. |
From Figure 10, we saw platelets and Creatinine Phosphokinase enzymes do not seem to have an effect on survival as well as with other variables including smoking, sex, high blood pressure, diabetes and anaemia; thus, it makes sense to drop these variables and not select them to build our model upon. Based on the correlation heatmap, the variables I will be choosing to use in my predictive models are time, serum_creatinine, ejection fraction, age, and serum sodium.
Phase 3 – Models Selection and Evaluation
For this phase, we used an iterative modeling approach to determine the best model for the predictions. In total, five different models were used: logistic regression, k-nearest neighbors, support vector machine, decision tree and random forest. A result and accuracy score about each model will be outlined below:
• Model 1: Logistic Regression
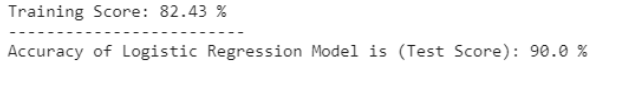
Logistic regression is somewhat similar to linear regression and is a classification model instead of a regression model, as it uses a logistic function to plot binary output model. The accuracy score obtain is noted down in Figure 11.
 |
|---|
| Figure 11: Logistic Regression accuracy table. |
With Logistic Regression, we were able to obtain an accuracy score of 90% with training score of about 82%.
• Model 2: Support Vector Machine
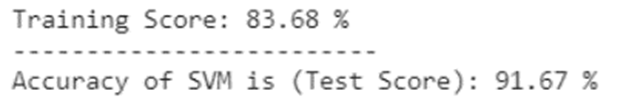
Support vector machine can be used for both classification and regression. The accuracy score obtained for SVM is in Figure 12.
 |
|---|
| Figure 12: Support Vector Machine accuracy table. |
With Support Vector Machine, an accuracy score for this predictive model was 91.67% with the training score of 83.68%
• Model 3: K-Nearest Neighbors (KNN)
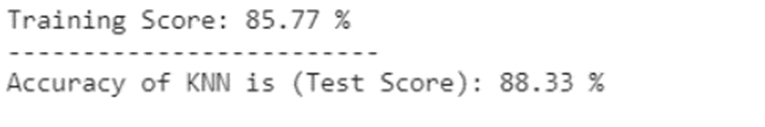
KNN is a non-parametric model used for both in classification and regression. It is also known as a lazy learning model with local approximation (Tripoliti, 2017). In KNN, we look for k neighbors and come up with a prediction. For the prediction, we used a k of 5, anything higher than 5 will generate in a reduction in our accuracy model.
 |
|---|
| Figure 13: Accuracy score for KNN predictive model. |
For KNN, the accuracy we got was 88.33% with a training score of 85.77% as noted in Figure 13.
• Model 4: Decision Tree
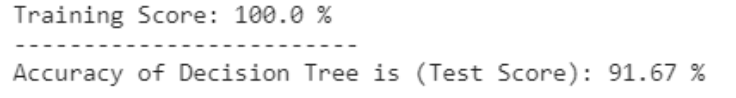
Decision Tree is used to solve regression and classification problems. Decision trees are used for dependent variable with continuous values, and classification trees are used for dependent variable with discrete values. Decision tree is derived from the independent variables, with each node having a condition over a feature. The nodes decides which node to navigate next based on the condition. Once the leaf node is reached, an output is predicted (Latha, 2019).
 |
|---|
| Figure 14: Accuracy score for Decision Tree predictive model. |
In Figure 14, we saw an accuracy of decision tree predictive model was 91.67% and our training score was perfect which is very interesting.
• Model 5: Random Forest
Random Forest is an ensemble model where multiple decision trees are combined for a stronger and more accurate model. Random Forest comes up with a robust, accurate model that can handle large varieties of input data with binary, categorical, continuous features (Latha, 2019).
 |
|---|
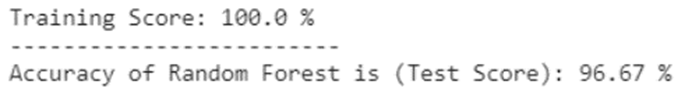
| Figure 15: Random Forest predictive model accuracy score. |
Based on Figure 15, the accuracy score achieved for Random Forest was 96.67% with a perfect training score on our dataset.
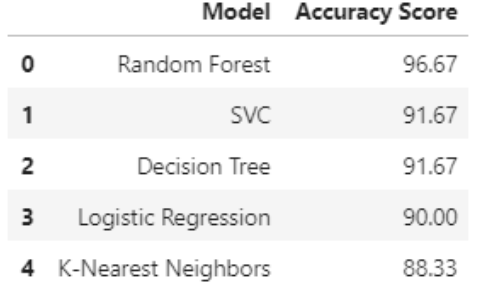
The overall summary of all accuracy score achieved by all five models is listed in Table 1, ranking from highest to lowest in terms of accuracy score.
 |
|---|
| Table 1: Accuracy score summary table of all predictive models |
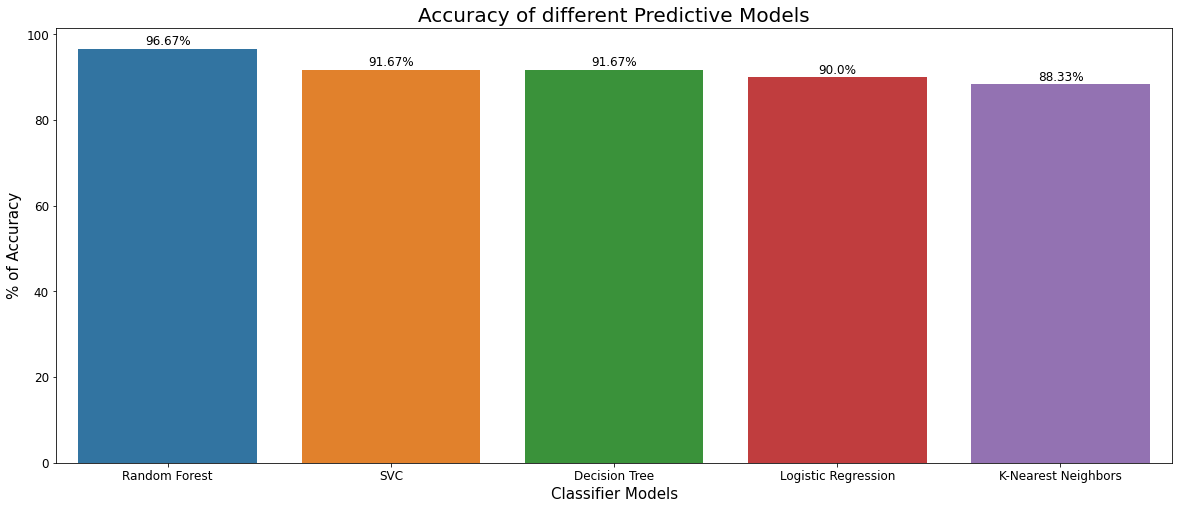
Figure 16 shows the accuracy score comparison among all models in a bar plot
 |
|---|
| Figure 16: Comparison of different predictive models on accuracy score. |
Discussion and Conclusion
As the exploratory data analysis phase was performed, the dataset and its variables were better understood, and their relationships were visualized. Relying on data analysis techniques like histograms, heatmap, and a data profiling step helps summarized all EDA analysis together. The dataset was very organized and cleaned as we did not see any missing values. Relevant features were identified through correlation heatmap and predictive models were built using these relevant and meaningful features in the second and third phases of our process. Out of 13 variables, eventually only 5 were thought to be relevant and have a great influence for our predictive model.
Out of the 5 models that we built through training data from our dataset and testing to achieve an accuracy score, Random Forest has the highest accuracy score with 96.67% for the prediction. KNN model was the worst performing model out of all the models we tested with 88.33% accuracy. There are more room for improvements if we can adjust hyperparameters using cross-validation to our dataset. In addition, I believe the data sample may be a little bit small with an n = 299. If we have more data sample, our predictive model may be much more accurate, and we may even be able to understand and select more features to build our model.
Overall, I believe by using Random Forest Model, we can accurately predict heart failure disease survival based on the given health attributes.
Acknowledgements
I want to thank the data science community from Kaggle for the dataset. I would like to acknowledge the whole Bellevue University Data Science Graduate Program for providing me an opportunity to learn about Data Science.
Appendix A
 |
|---|
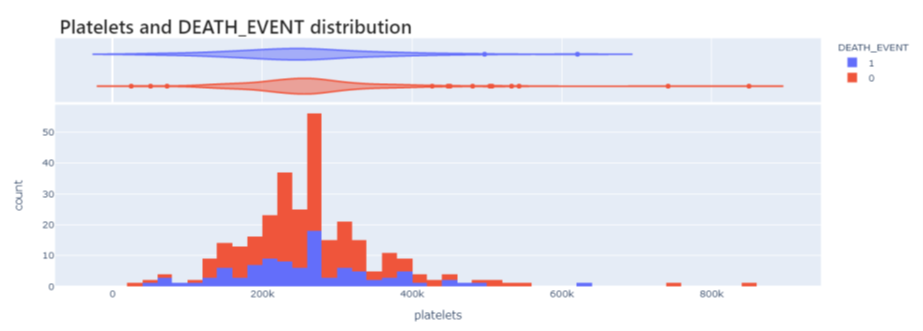
| Figure 9: Platelets Count on Survival Status |
References
- Ahmad T, Munir A, Bhatti SH, Aftab M, Raza MA. Survival analysis of heart failure patients: a case study. PLoS ONE. 2017; 12(7):0181001.
- Chicco, D., Jurman, G. Machine learning can predict survival of patients with heart failure from serum creatinine and ejection fraction alone. BMC Med Inform Decis Mak 20, 16 (2020). https://doi.org/10.1186/s12911-020-1023-5
- Dalen, J. E., Alpert, J. S., Goldberg, R. J., & Weinstein, R. S. (2014). The Epidemic of the 20th Century: Coronary Heart Disease. The American Journal of Medicine, 127(9), 807–812. https://doi.org/10.1016/j.amjmed.2014.04.015
- Faggella, D. (2020, March 4). 7 Applications of Machine Learning in Pharma and Medicine. Emerj. https://emerj.com/ai-sector-overviews/machine-learning-in-pharma-medicine/
- HealthITAnalytics. (2018, September 18). Using Big Data, Machine Learning to Reduce Chronic Disease Spending. https://healthitanalytics.com/news/using-big-data-machine-learning-to-reduce-chronic-disease-spending
- Latha, C. B. C., & Jeeva, S. C. (2019). Improving the accuracy of prediction of heart disease risk based on ensemble classification techniques. Informatics in Medicine Unlocked, 16, 100203. https://doi.org/10.1016/j.imu.2019.100203.
- Lawler, R. (2019, July 15). How doctors are using machine learning to improve health outcomes. Samsung NEXT. https://samsungnext.com/whats-next/how-doctors-are-using-machine-learning-to-improve-health-outcomes/
- Stephens C. What is a creatinine blood test? https://www.healthline.com/health/creatinine-blood. Accessed 25 Jan 2019.
- Stephens, W. (2019, June 19). Machine Learning Can Predict Heart Attack or Death More Accurately Than Humans. AJMC. https://www.ajmc.com/view/machine-learning-can-predict-heart-attack-or-death-more-accurately-than-humans
- Stewart, J., Addy, K., Campbell, S., & Wilkinson, P. (2020). Primary prevention of cardiovascular disease: Updated review of contemporary guidance and literature. JRSM Cardiovascular Disease, 9, 204800402094932. https://doi.org/10.1177/2048004020949326.
- Tripoliti, E. E., Papadopoulos, T. G., Karanasiou, G. S., Naka, K. K., & Fotiadis, D. I. (2017). Heart Failure: Diagnosis, Severity Estimation and Prediction of Adverse Events Through Machine Learning Techniques. Computational and Structural Biotechnology Journal, 15, 26–47. https://doi.org/10.1016/j.csbj.2016.11.001. Bellevue University Page | 18
- Varghese, D. (2019b, May 10). Comparative Study on Classic Machine learning Algorithms. Medium. https://towardsdatascience.com/comparative-study-on-classic-machine-learning-algorithms-24f9ff6ab222
- Varghese, D. (2019, February 18). Comparative Study on Classic Machine learning Algorithms , Part-2. Medium. https://medium.com/@dannymvarghese/comparative-study-on-classic-machine-learning-algorithms-part-2-5ab58b683ec0
- Yang, L., Wu, H., Jin, X. et al. Study of cardiovascular disease prediction model based on random forest in eastern China. Sci Rep 10, 5245 (2020). https://doi.org/10.1038/s41598-020-62133-5