Chicago Crime Analysis Using R
 |
|---|
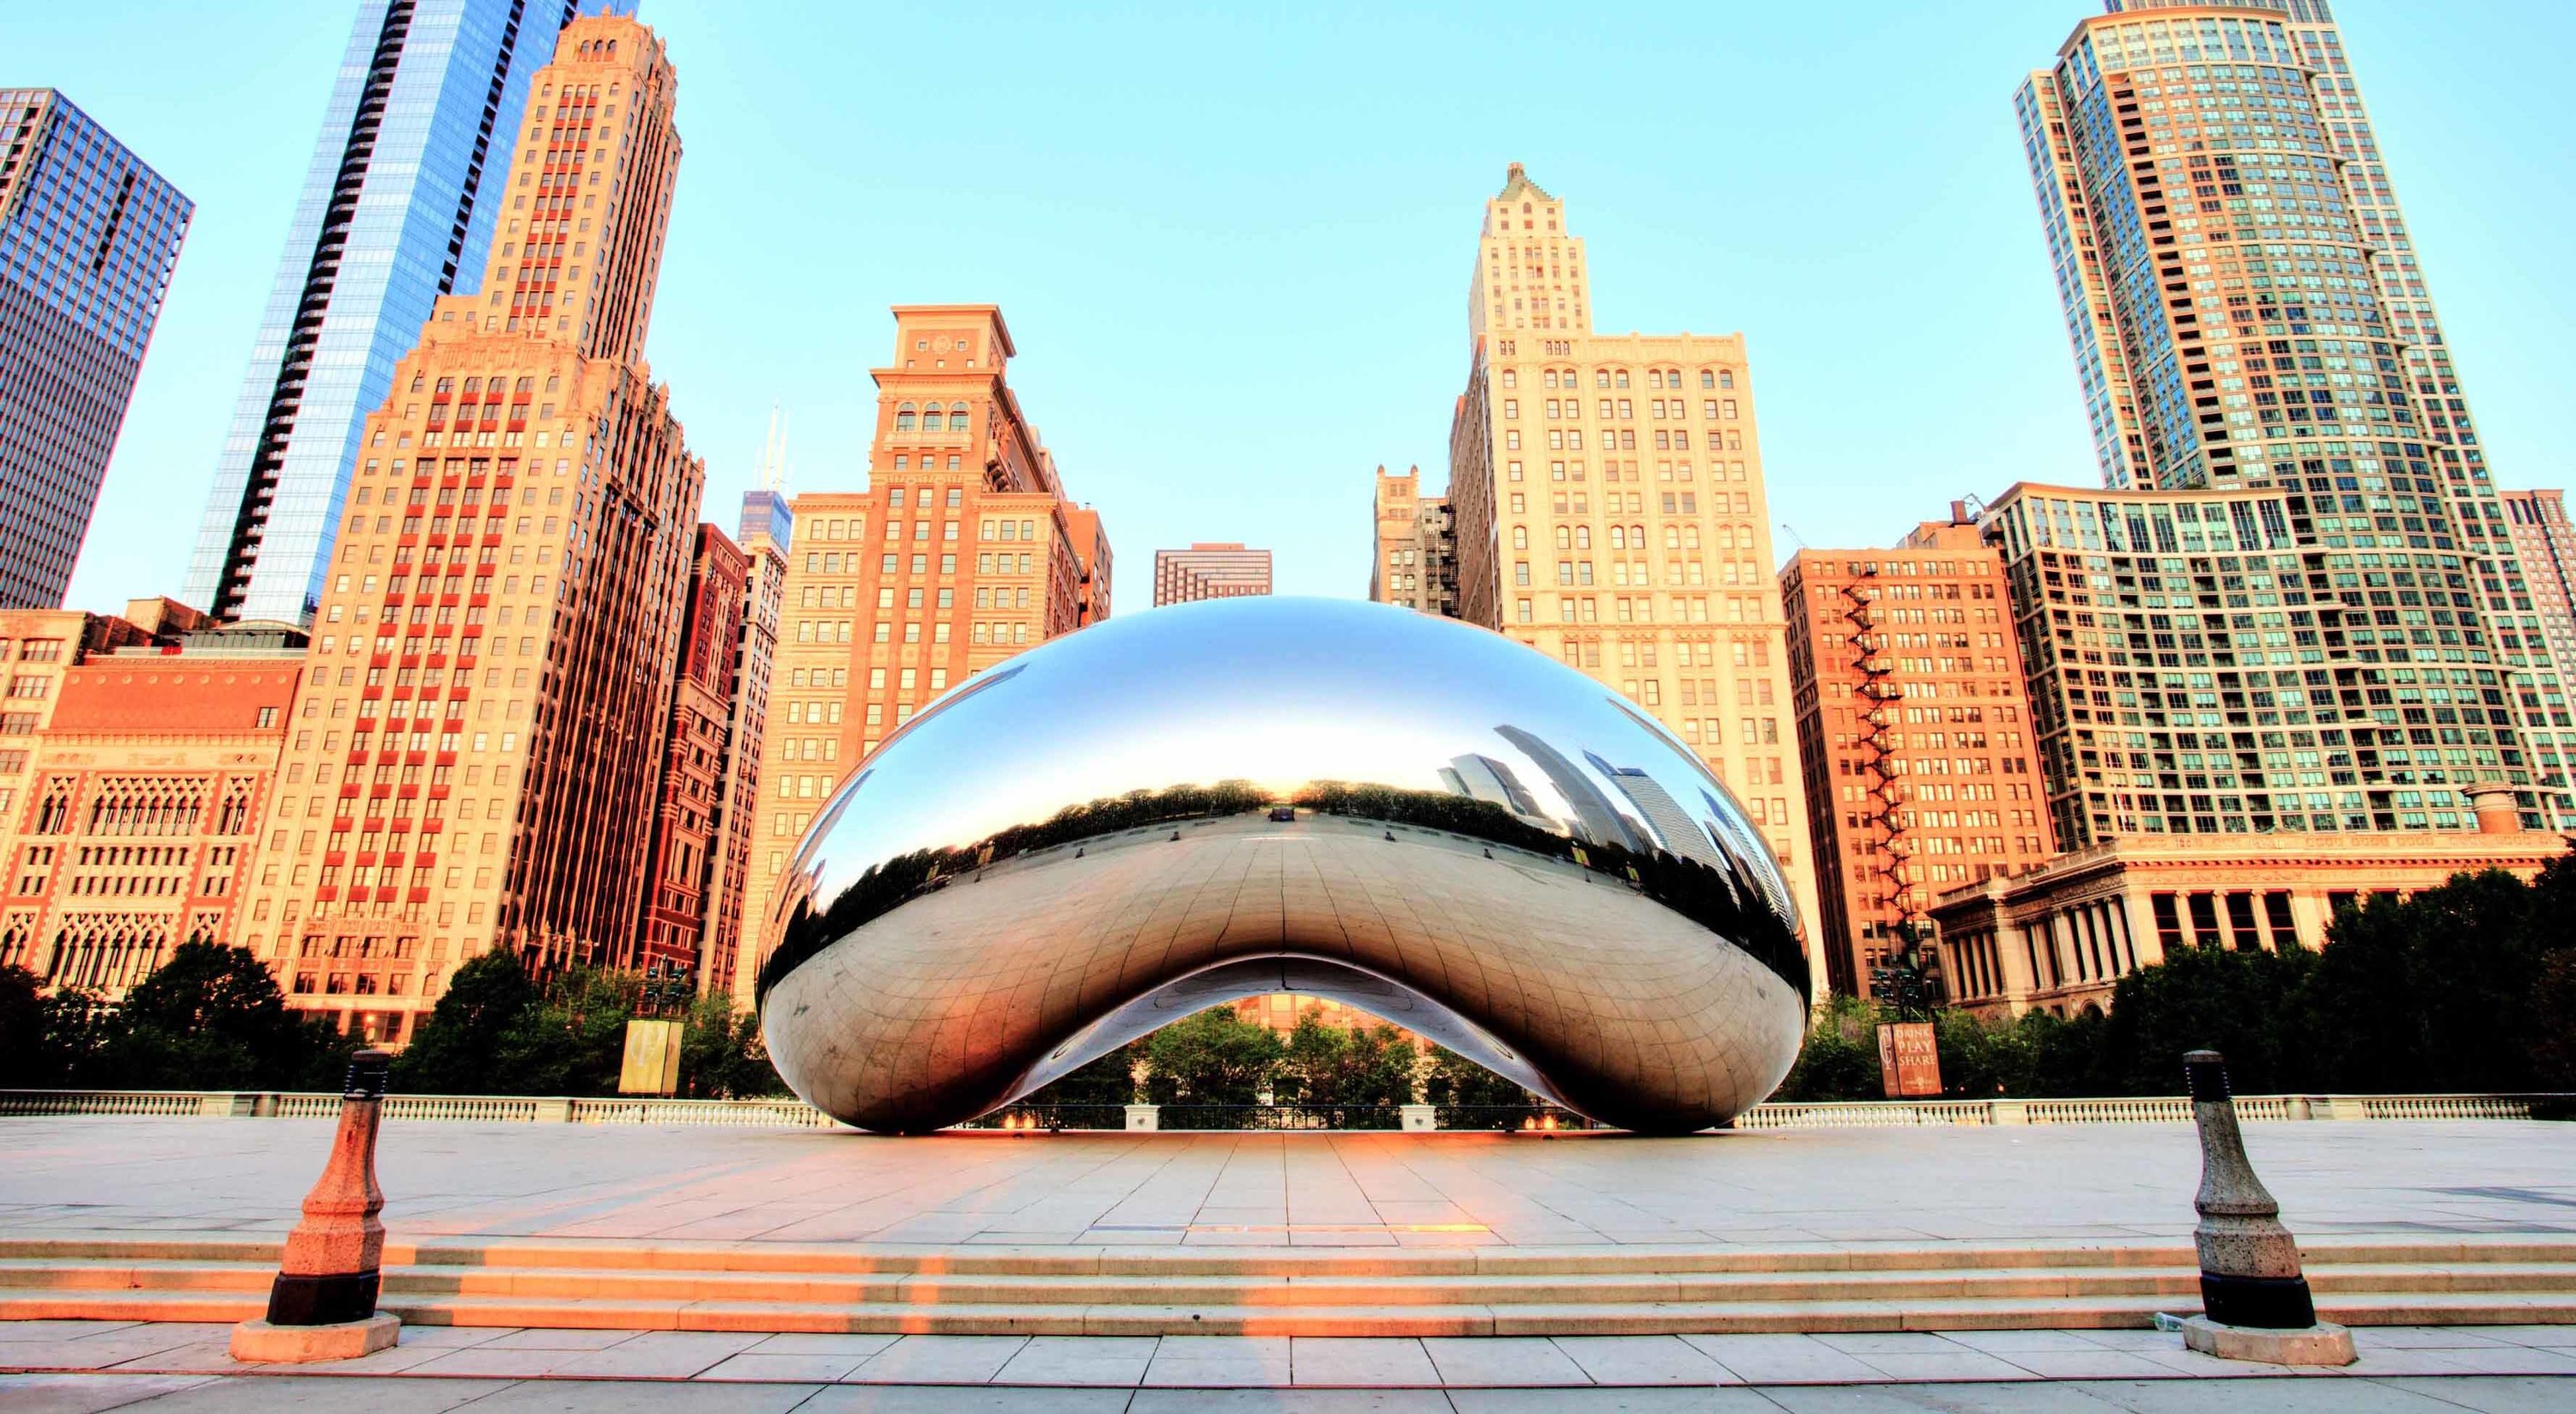
| Photo credit: Shutterstock |
Read about my analysis at Chicago Crime Analysis
Introduction
Chicago is a city in the State of Illinois, filled with many landmarks and it is the third most populous city in the United States. However, due to the high number of populations in the city, crime and traffic collision rates also increased. These unfortunate events can negatively affect the image and how tourists viewed the city. In the datasets, there are many types of crimes recorded by the City of Chicago as well as traffic crashes and collisions from 2015-2019. To further understand the relationship and to get the whole map outline the area where crimes most exist, the Chicago police stations dataset is included. This research project will help and tell a story of how the growing percentage of school drop outs can influence the crime rates. Furthermore, an increased in the population of Chicago over time can also have an impact on traffic collisions over the years. Even though, the percentage of school drop outs focused mainly on 2011 and 2012, it still provides a glimpse to how drop outs rates can influence the increased crime rates in Chicago.
Summary of Findings
- School drop out rates can have an influence on Chicago crime rates, and as the drop out rate increase the crime rate will also increase.
- Chicago traffic collisions increase over time, and as the weather start to transition into the winter, traffic collisions will also increase.
Dataset
- Chicago Police Stations Dataset: Chicago Police Stations
- Chicago Traffic Crashes Dataset: Chicago Traffic Crashes
- Chicago Public School Dataset: Chicago Public School
- Chicago Crime Dataset: Chicago Crime Data
Interesting Insights I found
For 2012, there was no significant relationship between crime rates and drop outs rates in Chicago. On the other hand, the relationship between traffic collision occurrences and month of the year was positively proportional. As the weather gets colder, the road and visibility conditions can decrease, thus, creating more crashes than summer where the sun is out. To me, this was a surprise because I thought there would be more accidents in the summer where tourists are most likely to visit.
Limitations In The Analysis
The limitations of this analysis is due to the limited amount of present data. These datasets only recorded up to 2017/2018 which we may not get a complete understanding of what Chicago’s crime rates and traffic collision rates are like in the present years. Furthermore, the dropout rates for this analysis was done using the year 2011 and 2012 which were the only two that were in the dataset. By having more drop out rates in other years, we can fully understand whether dropout rate has any influence on crime rates in Chicago.
Conclusion
After finished analyzing the datasets, I found that there was not really a significant relationship between the percentage of drop outs in 2012 and the influence on its crime rates for that particular year. There are many other factors that can influence the crime rates in Chicago. However, there was a significant relationship between the numbers of traffic collision occurrences and months of the year. As the month increases, the traffic collision occurrence also increase. The highest occurrences in traffic crashes tend to be around winter time (October - December), where the weather is not too friendly and roads are covered with snow and low visibility road conditions do not help in term of reducing the crash occurrences.
Overall, the analysis was done with no intention of biases. The results of my analysis were intended to show which crime type occurred the most and which area of Chicago where crimes most active. Over the years, Chicago crime rate has gone down but traffic collisions will continue to increase as Chicago population increases.


